7
$\begingroup$

If you search Google for span wise flow, the first result under the pictures tab is a image of a wing with the span wise flow at the trailing edge:

enter image description here
(Source)

If you look at some other photos you notice others pictures that show to span wise flow at the leading edge:

enter image description here
(Source)

Is the flow at the leading or trailing edge?

At first I though the flow must be at the trailing edge because this would cause the airflow to point more and more towards the tip of the wing. After a little thought I realized that the air(span wise flow) should be flowing along the leading edge because that is where the air splits up in the first place.

So basically I am asking if the span wise flow is flowing along the trailing or leading edge of the wing.

How would this air cause the airflow to gradually point towards the wingtip?

$\endgroup$
1
  • 2
    $\begingroup$ @mins is right, the decomposition is a theoretical tool that we use to understand the flow. The air does not 'splits up' in to air that goes chordwise and air that goes spanwise. It's the same as when you have a diagonal force, and you split it up in horizontal and vertical forces. The force is still diagonal, but we do the split up to make the evaluation easier. $\endgroup$
    – ROIMaison
    Commented May 31, 2017 at 7:43

4 Answers 4

10
$\begingroup$

The two pictures in the question only show how to decompose the speed vector into the normal and parallel components. They are nowhere near "real" flow vectors.

First I recommend to read this answer so you get an idea how air is accelerated and decelerated when flowing around an airfoil. Note that the low pressure area over the wing will suck in more air. This answer might also be helpful because it looks closer at the boundary layer.

With a swept wing the same happens, but now the flow will not stay at one wing section but show an added sideways component. Again, air is sucked into the low pressure area, but because that area is a little to the side of the direction of motion of the wing, the flow lines will initially move towards the center of the wing on the upper side in case of sweepback.

But that cannot last: The pressure recovery over the rear part of the airfoil reduces this bending, so the flow lines become almost parallel to the direction of motion of the wing. The lower the local pressure, the more the flow lines bend inward. Higher than ambient pressure at the trailing edge or on the lower side of the wing will bend the flow lines outward accordingly.
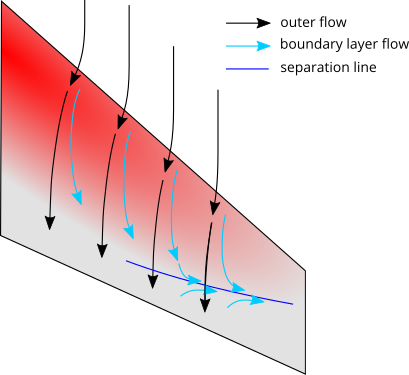
Flow lines approaching and over a swept wing

Let the red color denote suction: It bends the flow lines (black) towards it, creating a spanwise flow component. The higher the suction (the redder the color), the bigger the bending. The cyan arrows show the flow lines inside the boundary layer. By losing some of the early acceleration to friction but being subject to the same deceleration in the region of the pressure rise, the boundary layer flow shows a stronger tendency towards the tip. To be precise: The acceleration and deceleration acts in a direction perpendicular to lines of the local relative chord. The sketch above exaggerates this bending for the sake of clarity.

Now we must look at the boundary layer to get the full picture: Here the flow speed is reduced by friction, so the result of that initial inbound acceleration is worn away gradually. The result is a twist of the local speed vectors over the thickness of the boundary layer such that the inbound component is gradually reduced the closer you get to the wing's skin. Now the deceleration in the area of pressure recovery will slow down the already decelerated air close to the wing, and again that slowing will happen in a direction perpendicular to the lines of equal chord. If this deceleration is sufficient, it will leave the boundary layer flow with an outward speed component. Such a deceleration brings the flow close to separation so it occurs only at higher angle of attack when the wing approaches stall. Note that only the boundary layer will exhibit a tipwise speed component.

Only when the flow separates, the boundary layer thickens past the separation line (blue line in the sketch above) and the spanwise flow will become significant. Separated flow is characterized by a local forward speed component, and now, past the separation line, you get a layer of air which is left with mostly a spanwise component; outboard in case of a sweptback wing and inboard in case of a forward swept wing.


EDIT

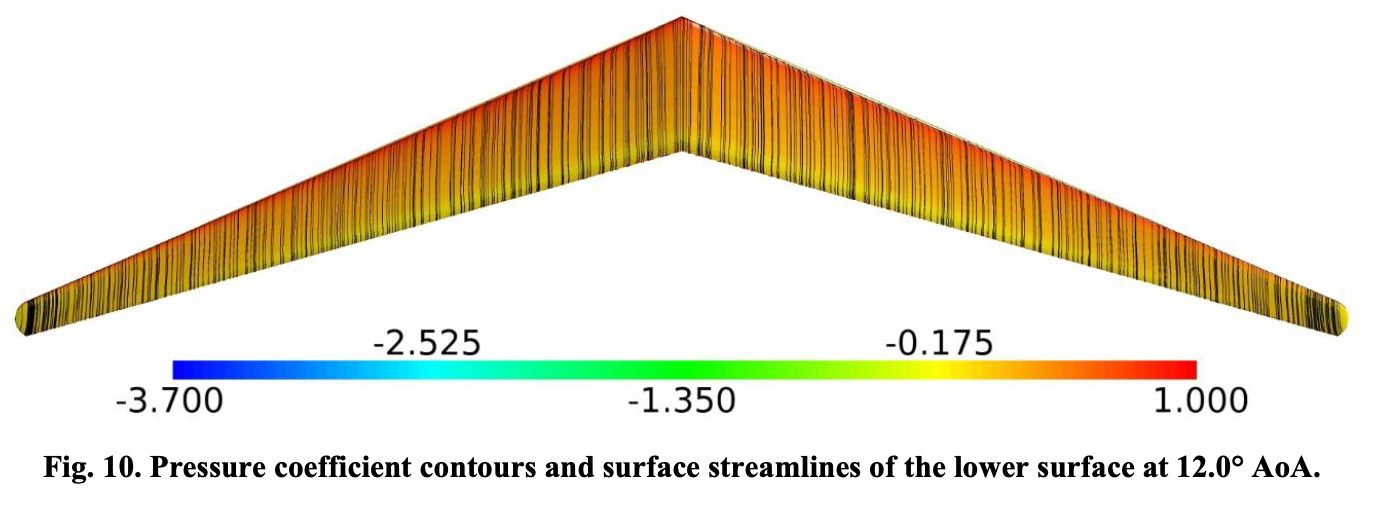
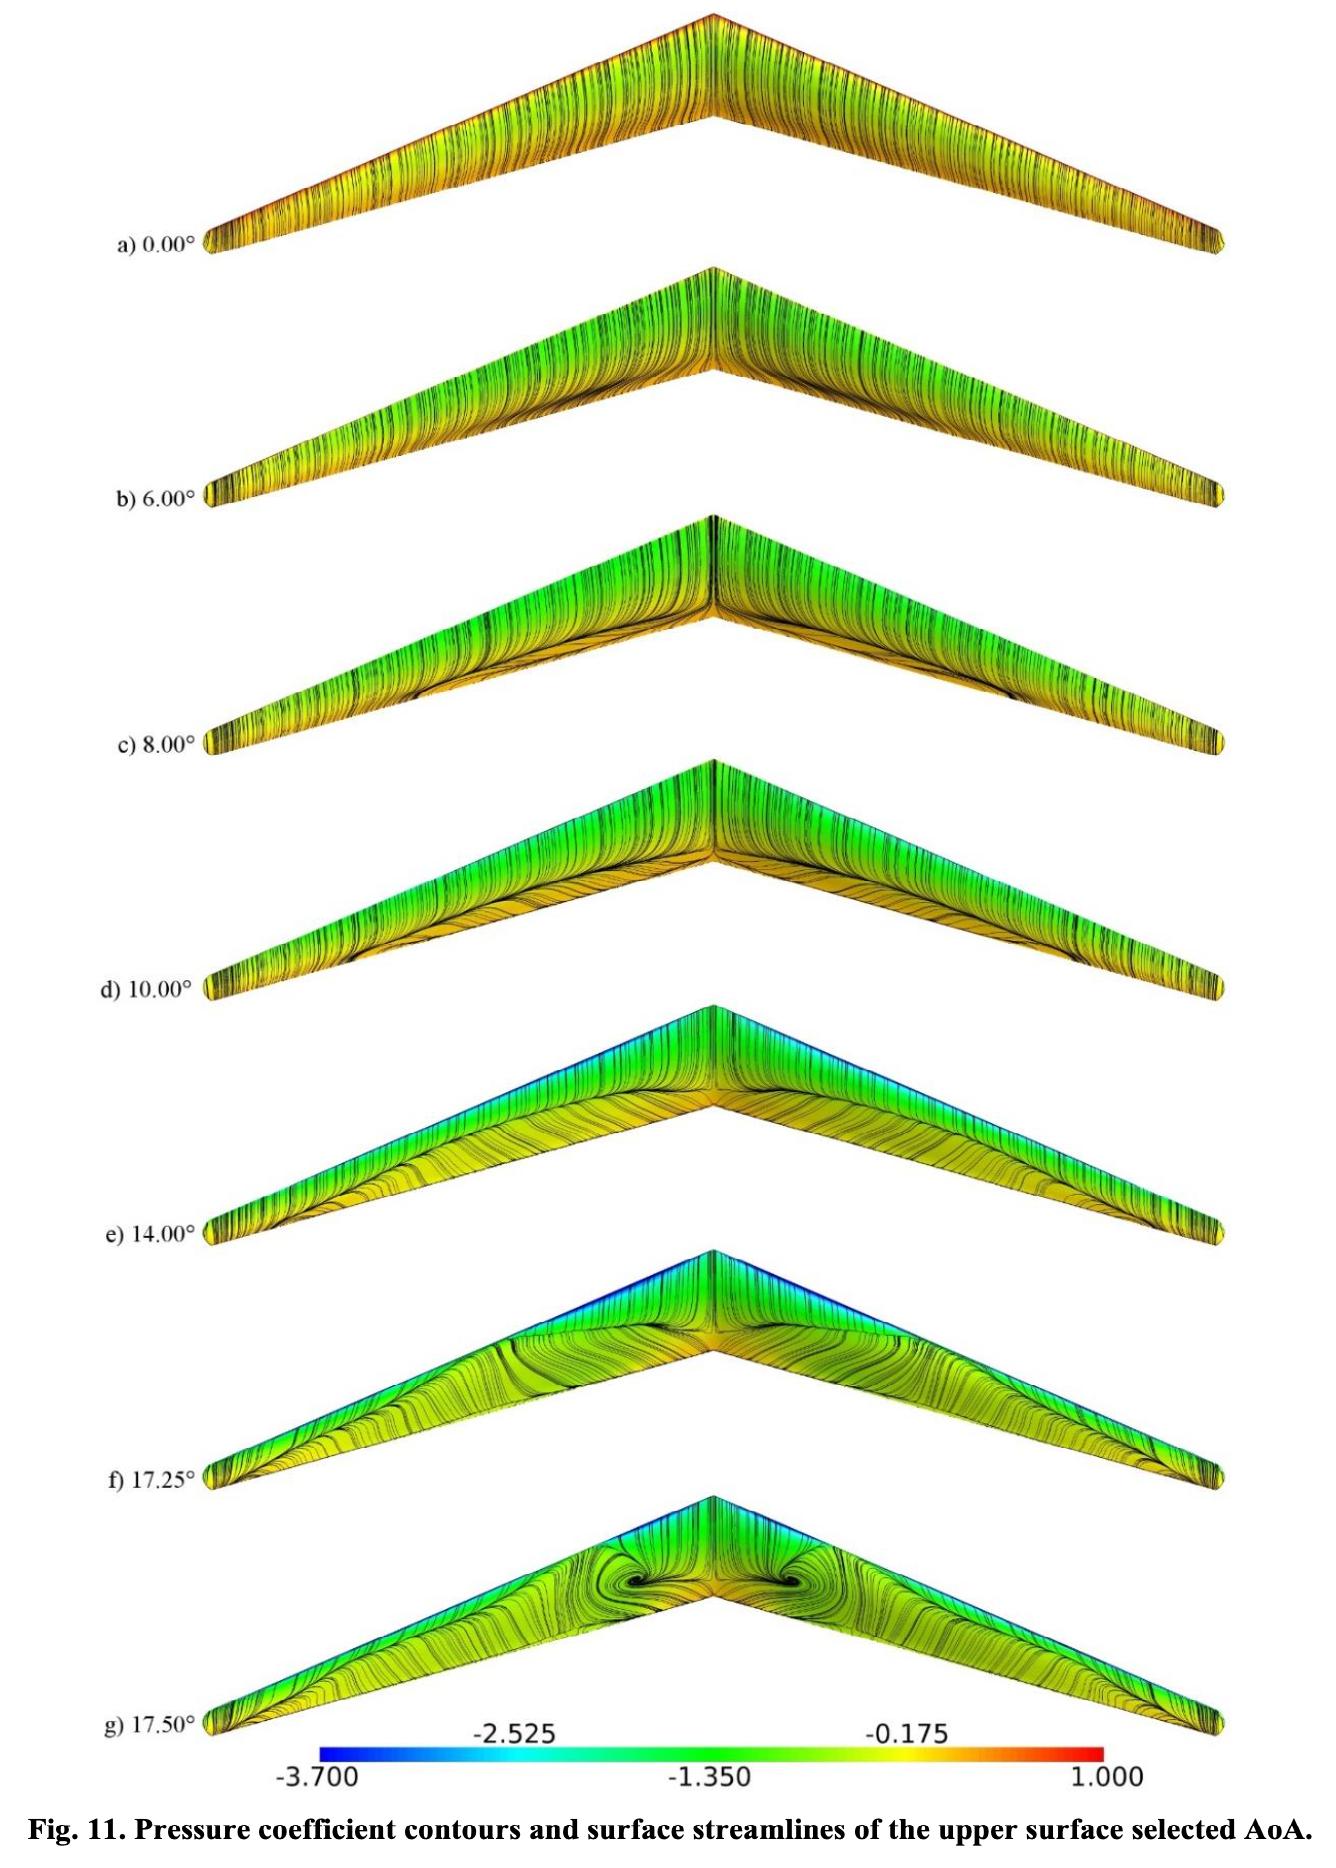
This paper presents a CFD study on the PRANDTL-D P-3C model aircraft using the OVERFLOW software. Figures 10 and 11 show the boundary layer flow on the lower and upper surface and illustrate nicely what happens. Note that this particular wing has a washout of -10° towards the tips which is essential to keep tip flow attached.
lower surface streamlines

Lower surface streamlines. Only the 12° AoA case is shown because all others look quite the same.
upper surface streamlines for angles of attack from 0° to 17.4°

Upper surface streamlines for angles of attack from 0° to 17.5°. The development of spanwise flow with the ever steeper pressure recovery at higher angles of attack should be evident. Note that flow direction past the separation line (the area with yellow-greenish tint) is from back to front.

$\endgroup$
20
  • $\begingroup$ I've read it four times and am still blinking. I wish I still had the books of the professor who could successfully explain concepts to freshly hungover students who had been sampling beers 1-10 in the Belgian Beer Cafe the evening before. $\endgroup$
    – Koyovis
    Commented Jun 3, 2017 at 4:09
  • $\begingroup$ @Koyovis: If you could be a little more specific, I could try and improve the answer. $\endgroup$ Commented Jun 3, 2017 at 5:06
  • $\begingroup$ Where is the resulting total spanwise flow towards the tip introduced at higher angle of attack? $\endgroup$
    – Koyovis
    Commented Jun 3, 2017 at 6:18
  • $\begingroup$ @Koyovis: Only the boundary layer will flow outward. In case of separation, this can be massive, but without separation this is limited to a thickening of the boundary layer on the outer wing. The outer flow will only show a tipwise speed component if local pressure is above ambient pressure. $\endgroup$ Commented Jun 3, 2017 at 8:28
  • 1
    $\begingroup$ @Wyatt Depends on what you mean with "flow". What accumulates at the tips is slow boundary layer air - the boundary layer gets massively thicker towards the tips of a swept wing at high angle of attack. Maybe you read this answer - it describes what happens. $\endgroup$ Commented Jun 12 at 17:42
1
$\begingroup$

Those pictures are valid at the leading edge, and at the trailing edge, and at all points in between on the wing area. But that is only an explanation on why wing sweep delays supersonic shock. In the pictures in the question, the real air flow is the black arrow flow marked Total, and that does not stream toward the tip. There is more to the story.

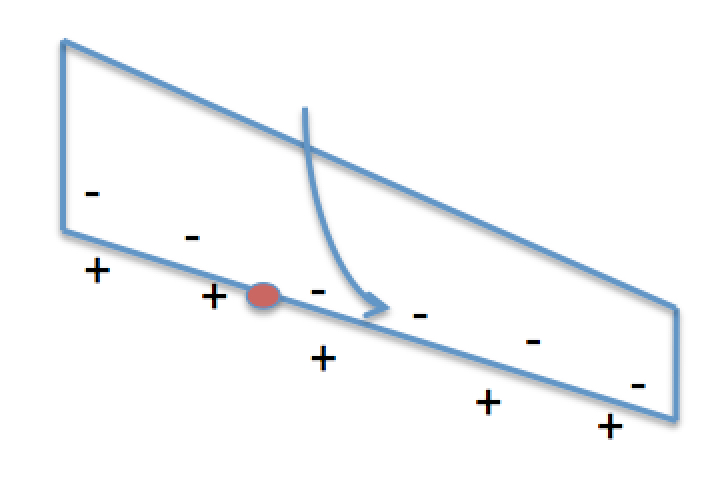
In the diagrams the black arrow marked Total is perpendicular with the fuselage. If a swept back wing is tilted at a higher angle of attack, the black arrow marked Total will start to deflect towards the wing tips. A partly stalled wing profile looks like this: enter image description here After the separation point there is low pressure. When we look at the top side of a swept back wing, the low pressure line runs along the trailing edge. Consider the red dot at the trailing edge: it sees a region with high pressure to one side (towards the root, coming from the bottom of the wing) and low pressure towards the tip, and air starts flowing towards the tip. So the streamlines look like in this picture. enter image description here So span wise flow is:

  • The Spanwise Component in the pictures in the question

  • An extra component that bends the airstream towards the wing tip.

This causes swept back wings to stall tip first, which causes a nose up pitching moment (which increases the stall) and loss of aileron control. Not desirable effects, and to be limited as much as possible.

$\endgroup$
5
  • $\begingroup$ Not sure what you mean, but have put a smaller comprehension step in the phrasing of the answer and will add more detail to the pictures when I have a chance. I find answers with too much unnecessary detail in the phrasing distracting. $\endgroup$
    – Koyovis
    Commented May 31, 2017 at 21:36
  • $\begingroup$ But, why does the total arrow point more and more at the wingtip before the wingtip is stalled at all. $\endgroup$
    – Crafterguy
    Commented Jun 19, 2017 at 18:50
  • $\begingroup$ Before flow separation that hardly happens, only in the boundary layer, as @Peter Kämpf explains. At low angles of attack, for understanding purposes, it is probably best to consider 99.9 % of the air flow streaming straight through, like the black arrows in your picture. Spanwise flow is then just a vector component which explains why sweepback works in delaying compressibility effects. Real spanwise flow as in my picture is only consequential at high angles of attack, in explaining the bad stall characteristics of highly swept wings. $\endgroup$
    – Koyovis
    Commented Jun 20, 2017 at 2:05
  • $\begingroup$ But consider a red dot outboard of the streamline and level with the first red dot. This one will be attracted towards the nearest low-pressure zone, which is inboard from it. So by your argument, the flow should swing wildly as it approaches the trailing edge. Also, the high pressure air below would spill up round the trailing edge, creating a local upwash of air and accompanying downforce component on the wing. I can understand this happening after the stall, but surely not before? $\endgroup$ Commented Mar 11, 2020 at 11:07
  • $\begingroup$ @Koyovis In your drawing of the cross section of a wing, the air behind the separation point is shown and later explained as a low pressure area, where it actually is a high pressure area. If it was low pressure, separation would result in airlift, which it doesn't. $\endgroup$
    – user55607
    Commented Apr 26, 2021 at 6:31
1
$\begingroup$

The two drawings in the question are confusingly wrong, as far as the names of the lines is concerned.

What is called the "relative wind flowing over the wing" and the "total" is actually the chord line. The reason it is not the "relative wind flowing over the wing" or "total" is because it does not show the actual total airflow over a swept wing. The reason it is the chord line is because it runs exactly on a chord, which in its turn runs exactly parallel to the longitudinal axis of the aircraft.

The "relative wind flowing over the wing" or the "total airflow" is not shown in either drawing. It would be a line drawn from the chord where any flow hits the leading edge, to the point where that same flow leaves the trailing edge. The fact that lines called "relative wind flowing over the wing" and "total airflow" in the drawings show neither the relative wind flowing over the wing nor the total airflow, is more than mildly confusing.

The line called "spanwise component" or "spanwise" is neither the one, nor the other. The spanwise component of the airflow would be a line drawn perpendicular to a chord line, between the extension of that line behind the trailing edge and the point where the airflow that hits that chordline at the leading edge leaves the trailing edge. This line is not drawn.

The chordwise component is a line drawn over the chord line from the leading edge to a point behind the wing, perpendicular to the point at the trailing edge where the flow over that chord line leaves the trailing edge, which is also the 'fuselage' end of the spanwise component.

Please keep in mind that if direction of airflow is expressed in a spanwise an a chordwise component, these must run parallel to span and chord of the aircraft. Also note that, if airflow over a backwards swept wing has a spanwise component, this airflow path must by definition be longer than the chord it runs from.

$\endgroup$
0
$\begingroup$
  1. As some other answers have hinted, the question suffers from the misconception that the physical location of each of the vector arrows, including the small "spanwise" arrows, is intended to show the physical location on the wing where the airflow is moving in some given direction. That is not the intent at all. Any one of the vector triangles is intended to apply to the entire general area in which it is drawn. Any one of the vector triangles could have been drawn either in the manner in the top diagram, or the bottom diagram, without changing the meaning of the illustration. The smaller vectors are simply components of the larger vectors. When we decompose a velocity vector into two or more other velocity vectors, we aren't implying that at one point in space the total velocity vector points in one direction and at another point in space the total velocity vector points in another direction. Just like when we decompose the wind vector into "headwind" and "crosswind" components, we aren't implying that the wind is blowing in different directions at different points in space. So both diagrams are saying the same thing-- or at least they would be if the top diagram omitted all the triangles except for one near the middle of the wing. Similarly, it would have been equally valid to draw each set of arrows so that all three "tails" originated from a single point, or so that all three "heads" were co-located at a single point. Arranging the arrows in a closed triangle simply makes it clear that the smaller arrows are components of the larger arrow, and the larger arrow is equal to the vector sum of the smaller arrows.1

  2. When we speak of the "relative wind", we generally mean the free-stream relative wind created by the aircraft's motion through the airmass. The free-stream relative wind is the direction that the airflow would take if the aircraft were not physically present to "bend", slow down, speed up, or otherwise disturb the airflow. This is not exactly the same as the actual airflow.

  3. So why does the upper diagram depict the "relative wind" arrows as being longer near the wing root than at the wing tip? This makes no sense (unless the aircraft is in a very tight circle to the left!). The length of a vector represents its magnitude, and the logical interpretation of the diagram is that the speed of the "relative wind" is greater at the wing root than at the wing tip, which is false. Unless the arrows are only intended to represent direction and not magnitude-- which would be a poor choice of convention in an illustration intended for pilots, who are (or should be) familiar with the concept of "vectors" in the classical sense, representing a magnitude as well as a direction.

  4. Both diagrams suffer from the error of incorrectly defining the meaning of "spanwise" and "chordwise". "Spanwise" means perpendicular to the longitudinal axis of the aircraft, not parallel to the leading edge, trailing edge, quarter-chord line, etc. "Chordwise" means parallel to the longitudinal axis of the aircraft, not the shortest distance from leading edge to trailing edge. Drawn correctly, for the "relative wind" direction illustrated here, the "spanwise" arrow would have zero length, and the "chordwise" arrow would be identical to the "relative wind" arrow.

  5. If we are interested in describing the actual airflow rather than the free-stream relative wind, the same convention applies as to the direction of "spanwise" and "chordwise". If we re-labeled the black arrows as "airflow" rather than "relative wind", and we re-drew the red and blue component arrows correctly as described in point number 4, we would have an illustration of a swept wing that was experiencing zero spanwise airflow.

  6. The real direction of the actual airflow over a swept wing is a complex subject that is addressed in at least one other answer to this question.

  7. The point the diagrams seem to be trying to make is that even in the (theoretical) absence of any actual disturbance of the airflow direction by the wing-- i.e. even considering only the free-stream "relative wind"-- a swept wing would still inherently experience some airflow component that is parallel to a reference line such as the leading edge, trailing edge, or quarter-chord line. But they don't make that point very well. It wouldn't be correct to call that airflow component the "spanwise" airflow component, and it's confusing to make any reference to "airflow" at all when we are only considering the free-stream relative wind.

  8. The long and short of it is that both diagrams represent typical ground-school garbage, produced by someone who likes to draw nice, bold, meaningless illustrations.

Footnotes:

  1. Compare for example the two force vector diagrams in this related ASE answer "What does the pressure distribution over a glider's wing look like?". The diagrams have the same meaning regardless of where the arrows are drawn, but by arranging them in a closed triangle with the head of each arrow connected to the tail of another, we make it clear that their net sum is zero. It wouldn't change the meaning of the right-hand diagram if the red and blue arrows were arranged in a triangle on the left-hand side of the black arrow rather than on the right-hand side.
$\endgroup$
0

You must log in to answer this question.

Not the answer you're looking for? Browse other questions tagged .