38
$\begingroup$

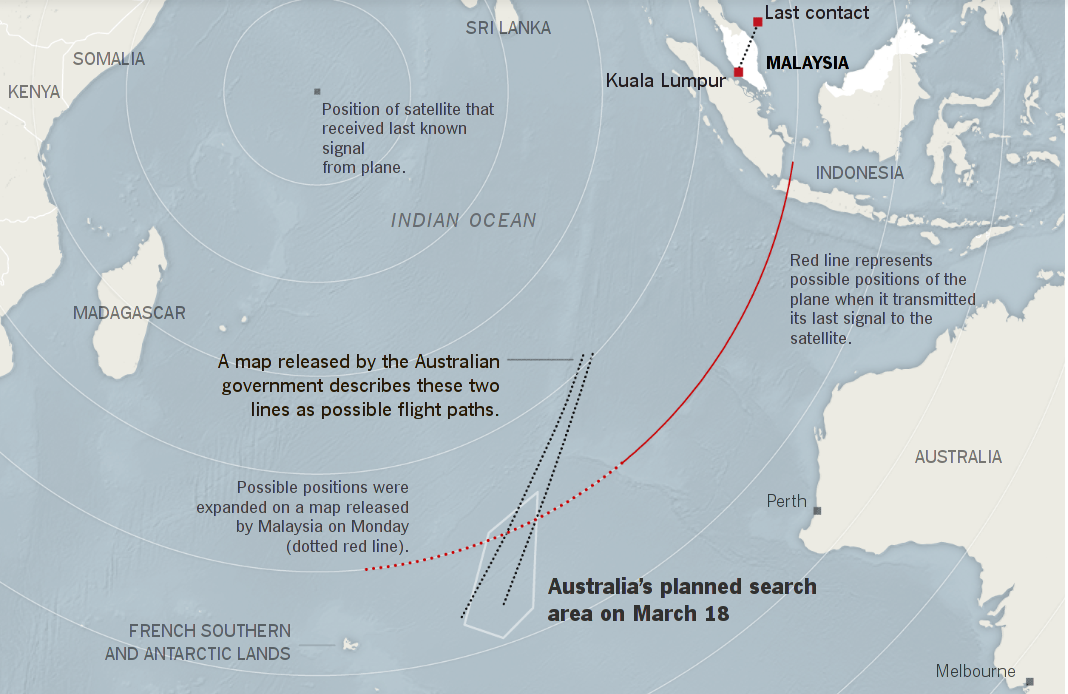
I am reading this article on the NY Times, where they show two possible flight paths of the missing flight MH370 in the South Indian Ocean:

enter image description here

I am wondering how they can come up with such specific paths, when the only information we have are those two arcs (those arcs are not paths, rather the last satellite ping happened somewhere on the arc).

How can anybody create a computer model with just this information? Or does it mean that the modelers have more information available than the general public?

$\endgroup$
1

5 Answers 5

43
$\begingroup$

how they can come up with such specific paths?

Diagrams in news organisations graphics published in March and April 2014 vary widely in what they show and appear to be artistic impressions. These should not be relied on in any way.

To calculate a variety of likely flight paths, it seems Inmarsat engineers, and other parties to the official investigation, used a number of sets of information including but not limited to:

  • satellite communication timings giving distances from satellite.
  • satellite communications frequency variations giving relative motions.
  • knowledge of variations in satellite orbit.
  • knowledge of variations in satellite temperatures (daylight exposure etc)
  • knowledge about signal processing timings in various equipment.
  • characteristics of the aircraft (load, fuel consumption rates, etc)
  • autopilot modes of operation (route, heading, track. magnetic, true, ...)
  • etc.

The analysis was improved and refined over time, resulting in newer estimates of the flight path and final coordinates.

Other independent groups of people have published their own analyses which come to broadly similar conclusions. E.g. the self-titled "Independent Group" associated with Duncan Steel


Inmarsat paper, October 7 2014.

A paper "The Search for MH370" published in the Journal of Navigation by Ashton et al. (2014). describes in some detail how the Inmarsat engineers used satellite data to determine probable flight paths for the aircraft.


ATSB report. August 18 2014

The Australian Transport Safety Bureau released a revised version of their June 26 report.

enter image description here


ATSB report. June 26 2014

The Australian Transport Safety Bureau release a 54-page report "MH370 - Definition of Underwater Search Areas" which goes into greater detail than any prior official report and shows much more of the calculations that were performed on the Burst Frequency Offsets to calculate probable final position of MH370.

In particular the appendices describe some equations that were used.

enter image description here
A small extract from the report


Raw Satellite Data. May 27 2014

The raw satellite data was made available on 27/5/2014 in response to requests from relatives of the passengers. This shows burst timing offsets (BTO) and Burst Frequency Offsets (BFO) for communications between the Inmarsat ground station and MH370.


ATSB document. May 26 2014.

The Australian ATSB released a factsheet that outlines what is known and reiterates the general description of how the tracks were calculated:
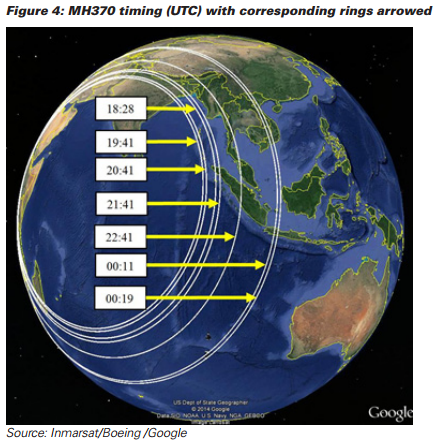
enter image description here

enter image description here

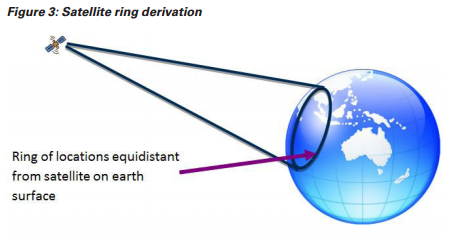
By taking the maximum speed of the aircraft into account, the rings can be reduced in length to arcs – there are some areas of the rings it simply could not have reached.

There are a large number of speeds and headings that can be consistent with a BFO recording. These are limited, however, by the operational constraints of the aircraft. Candidate paths of different speeds were created which met the BTO ring location/time constraints and the predicted BFO values of these paths have been compared with the recorded values. The better the match, the higher the probability that the path was close to that of MH370.


Release of raw data from satellites. May 27th 2014

On May 21st 2014 CNN reported that the satellite data and description of analysis would be published. No date has been specified.

"In line with our commitment towards greater transparency, all parties are working for the release of the data communication logs and the technical description of the analysis for public consumption," Inmarsat and the Malaysian aviation officials said in a joint statement.


Inmarsat Statement. March 24 2014

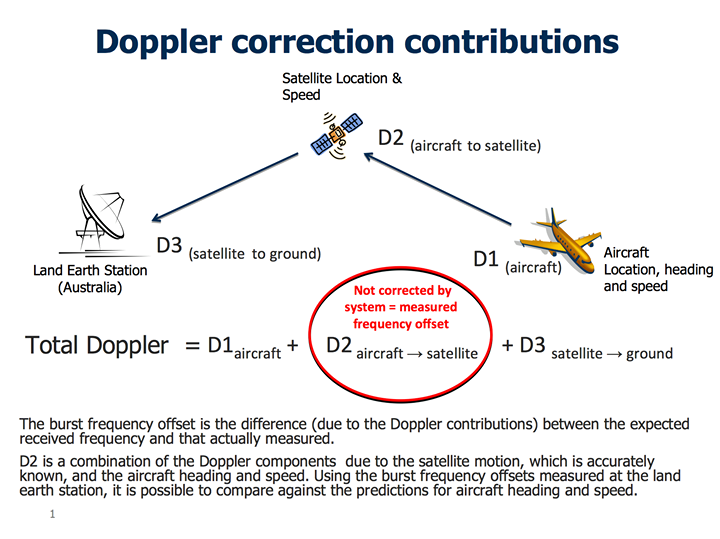
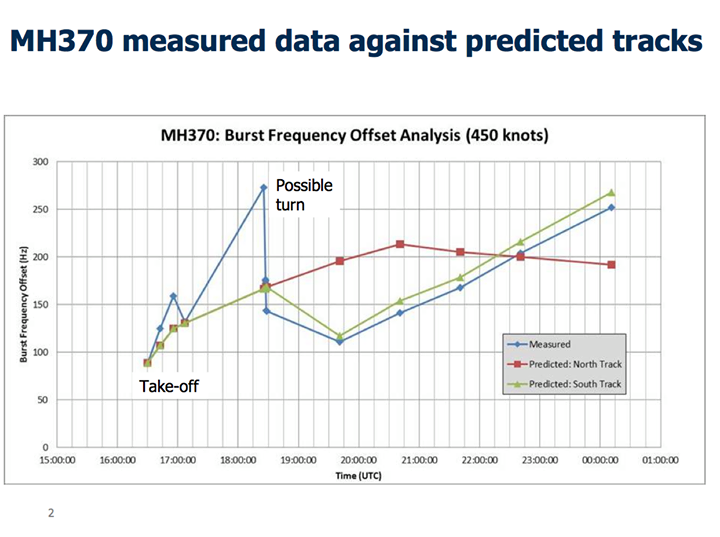
On March 24th 2014, Inmarsat stated that a new analysis of the records of satellite handshakes with MH370 were able to use doppler effects in the signals together with an analysis of similar satellite handshake data from other Malaysian 777s to determine that MH370 flew into the Indian Ocean and ruled out flight paths to the previously described northern corridor.
enter image description here
From INFORMATION PROVIDED TO MH370 INVESTIGATION BY UK AIR ACCIDENTS INVESTIGATION BRANCH (AAIB) 25/03/14


Malaysian Defence Minister statement. March 21 2014.

On March 21st, a little light was shed on this process by a statement attributed by New Straights Times to Malaysian Defence Minister and acting Transport Minister Datuk Seri Hishammuddin Hussein.

"The investigations team received the complete raw Inmarsat satellite data, which included the six handshakes at approximately 3 pm on Wednesday, March 12."

"This type of data is not normally used in investigations of this sort. It is only because we have so little other information to go on in this difficult and unprecedented situation that the data is being used.

"Upon receiving the raw data, the Malaysian authorities immediately discussed with the US team how this information might be used. The US team and the investigations team then sent the data to the US, where further processing was needed before it could be used.

"Initial results were received on Thursday, March 13 at approximately 1.30 pm, but it was agreed by the US team and the investigations team that further refinement was needed, so the data was again sent back to the US.

"The results were received at approximately 2.30 pm on Friday, March 14 and presented to the investigations team at a high-level meeting at 9 pm on Friday. The UK AAIB, who had also been processing this data independently, presented their results - which concurred with ours and those of the US team – at that meeting.

"The Prime Minister was briefed on this satellite information at 8 am Saturday, March 15 and publicly announced it at the press conference at Saturday lunchtime.

(my emphasis)

Obviously the above does not describe the actual calculations involved. However it does confirm that the satellite data had six handshakes (presumably at hourly intervals up to 08:11).


Early speculation

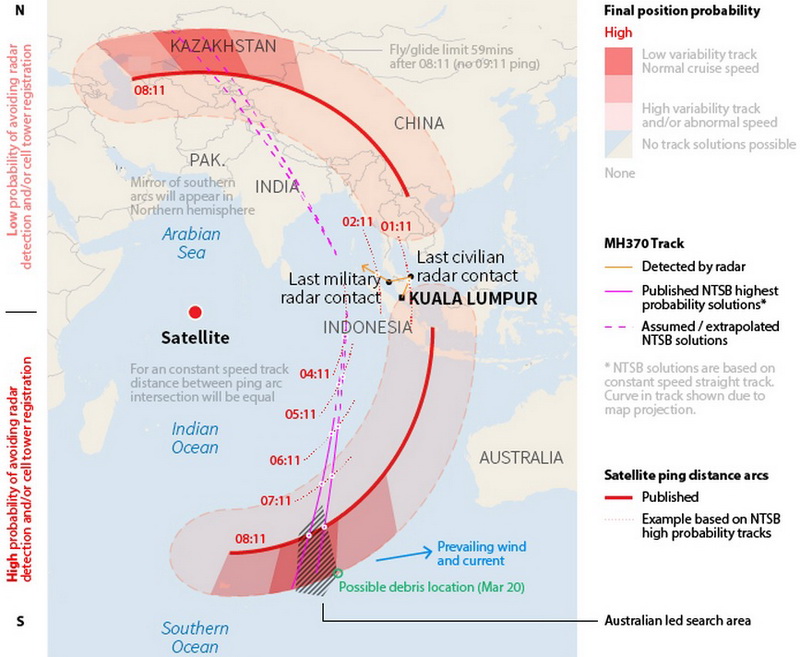
The graphic below, illustrates one idea for how these track might have been deduced. It is a result of speculation rather than a reporting of information actually provided by the people who made the calculation.

The graphic suggests that the NTSB calculated possible paths based on data that is not public and that the NTSB were able to assign probabilities to those paths. As far as I know, neither Inmarsat, the NTSB nor the Australian government (or it's agencies) have made public the data or method of calculating these tracks.

The graphic below suggests several Inmarsat pings were used (the example shows 01:11, 02:11, 04:11, 05:11, 06:11, 07:11 and 08:11 but these are probably speculation).

So far as is publicly known, there was no ping at 09:11 or later which suggests the flight ended between 08:11 and 09:11. This is broadly consistent with maximum fuel range of the aircraft. The labelled NTSB solutions suggest that NTSB calculated that no other constant speed (and heading?) tracks fit the data.
enter image description here
source Scott Henderson

which says ...

For a constant speed track, distance between ping arc intersections will be equal.

NTSB solutions are based on constant speed straight track. Curve in track shown due to map projection

A later version of this graphic adds a disclaimer saying that the tracks and zones are not accurate and are symbolic only.

We do know that NTSB sent staff to Malaysia to assist in the search. We know that Inmarsat provided data to the investigating teams.
$\endgroup$
2
  • $\begingroup$ These tracks have no credibility unless you apply selective logic ignoring aspects which can't be reconciled. The satellite BOF track does not match the early flight observed by radar at all except by "bent" logic. Once the hypothetical turn south is made past Sumatra satellite data shows velocity towards the Satellite whilst the track infers velocity away. This explanation serves to explain the incantations of a voodoo belief system, but has no relationship to MH370. More taxpayer money about to be wasted to stroke certain egos. $\endgroup$
    – user2357
    Commented Jul 19, 2014 at 20:42
  • $\begingroup$ In their Flight Path Analysis Update of 8 October 2014, the ATSB explain how they used the BFO data to identify a range of times for a turn south, consistent with the primary radar track associated with MH370. See "Refinement of southern turn location using ground initiated phone call data" on page 8. $\endgroup$ Commented Oct 14, 2014 at 14:29
20
$\begingroup$

The "related article" specified in your link has this to say:

Searching one possible flight path, Australia said it would focus its efforts in a specific stretch of the southern Indian Ocean, using computer models of the plane’s possible flight path that take into account undisclosed satellite data, wind conditions and ocean currents and some assumptions about how fast it was flying and how much fuel it had left.

So yes, apparently they have more information than the general public does.

$\endgroup$
8
$\begingroup$

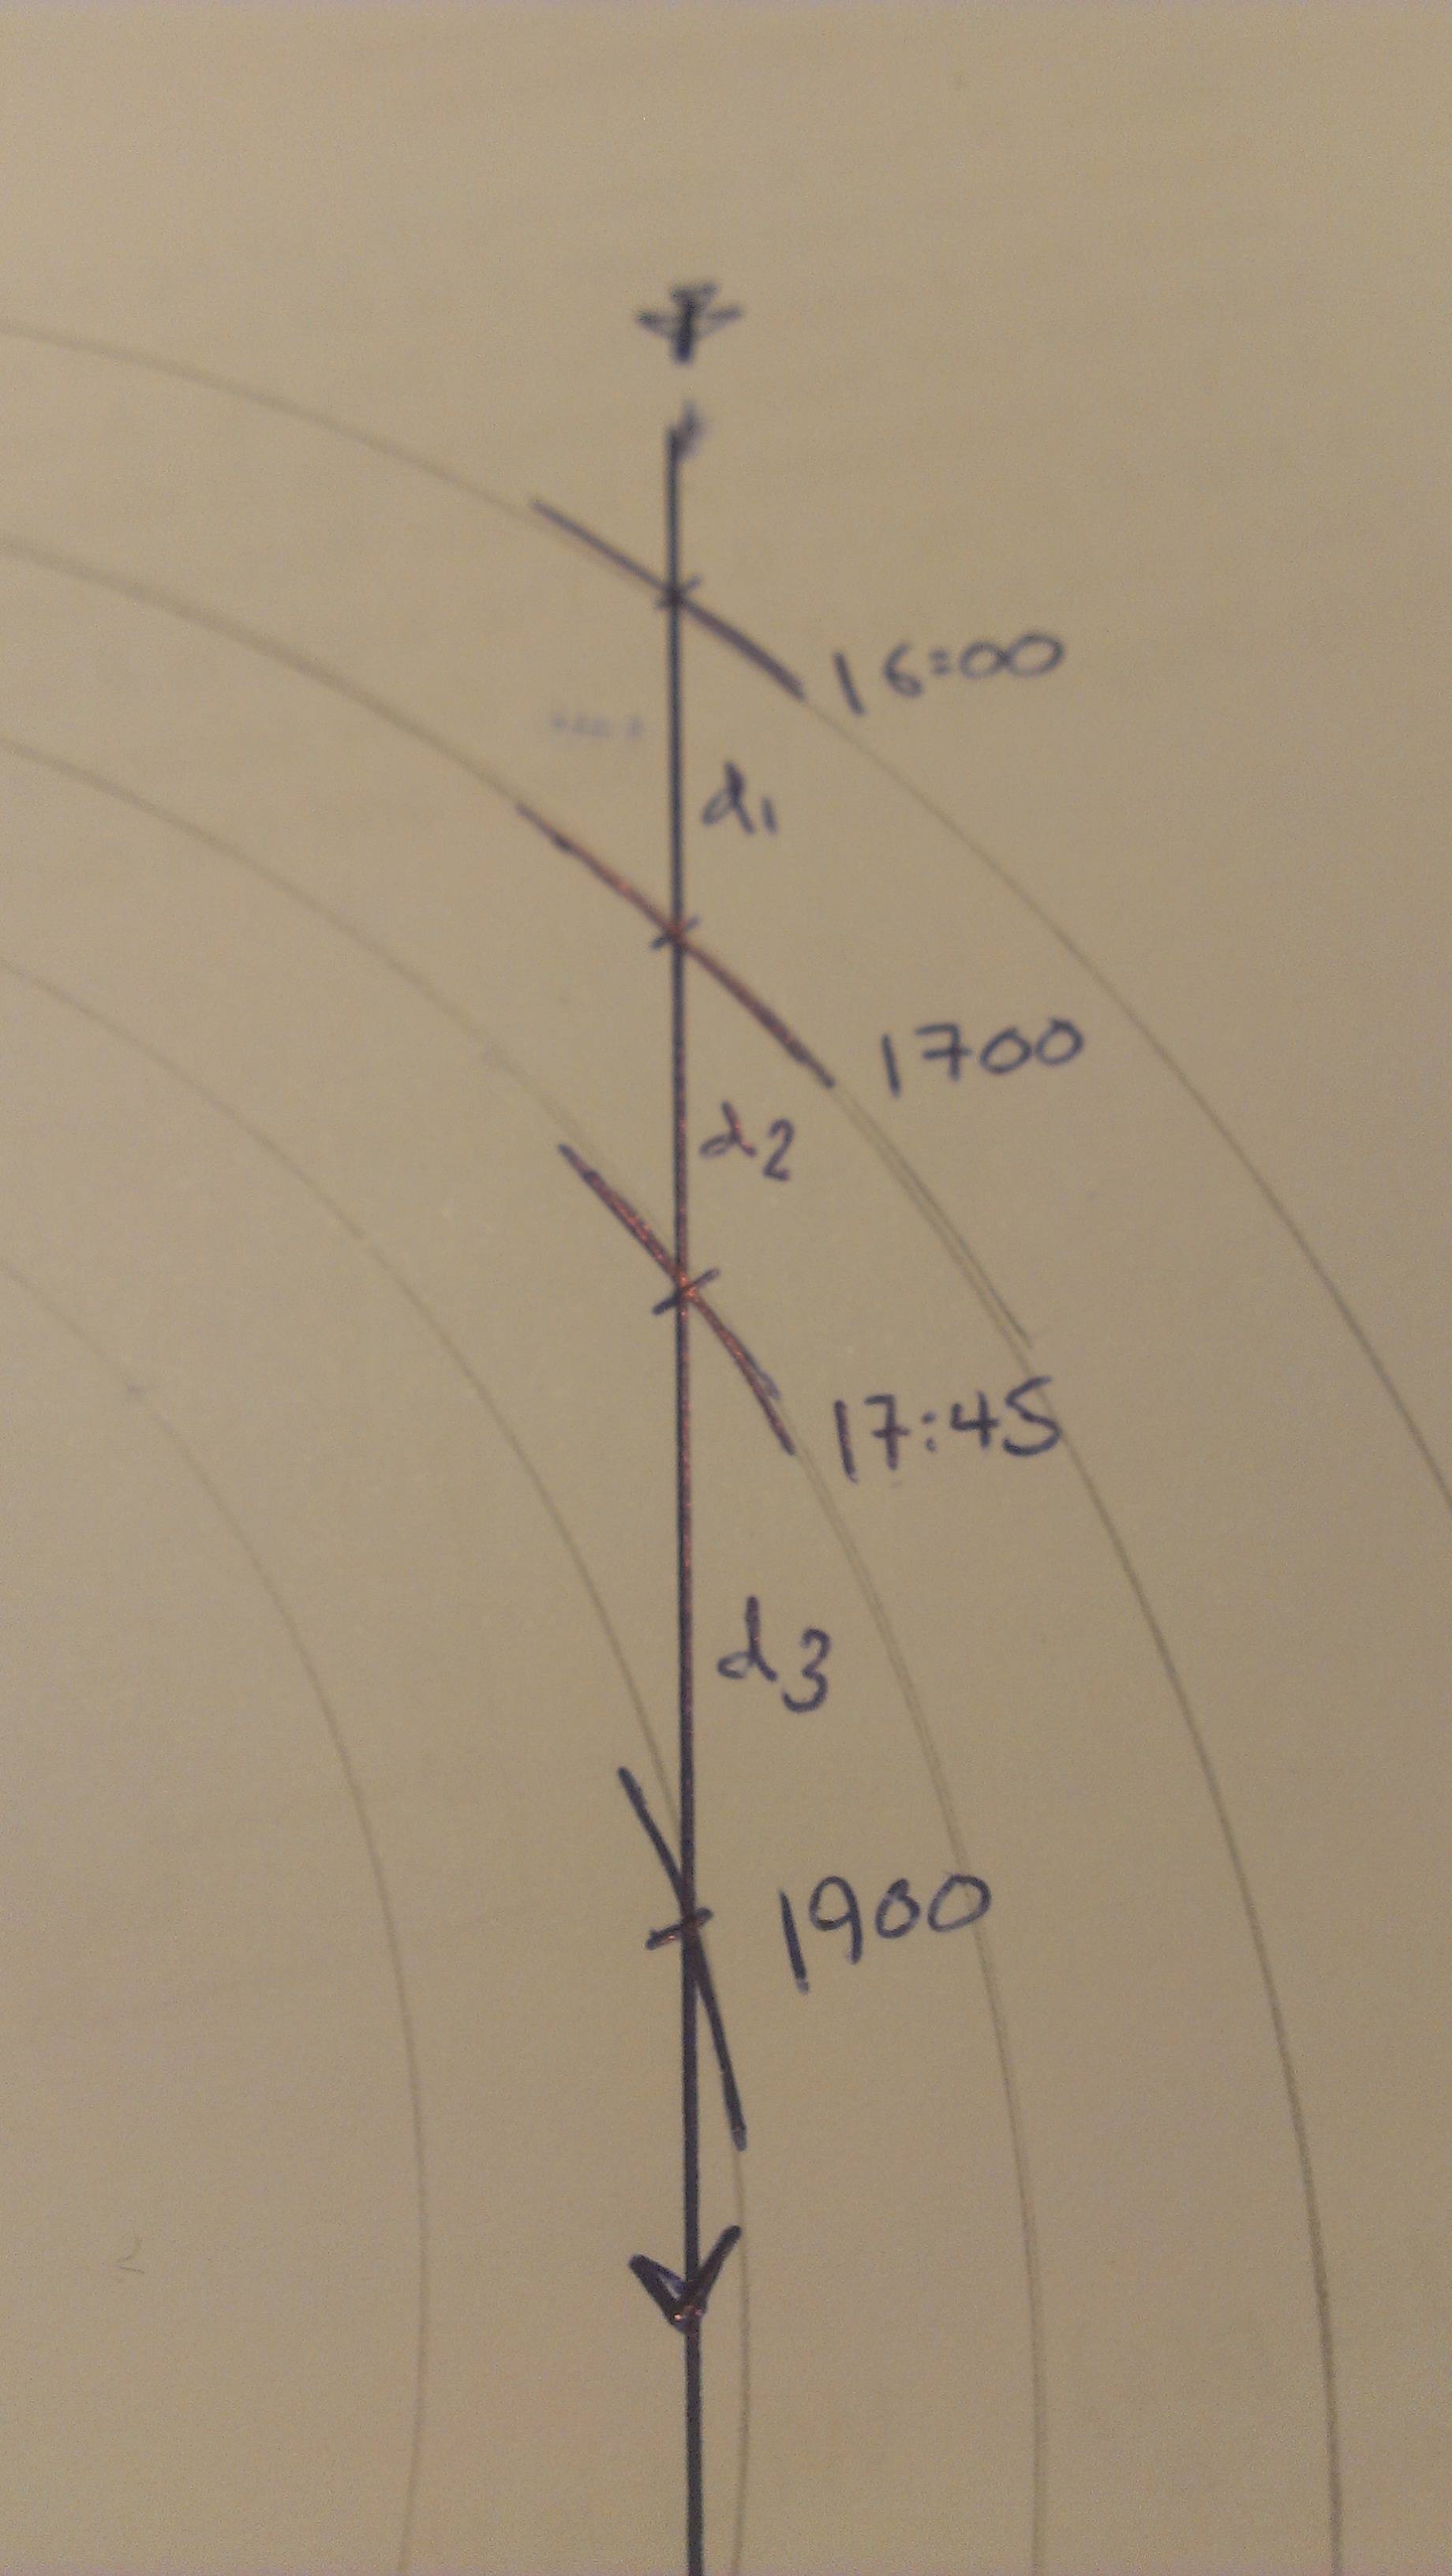
My personal guess: I think what they've done is to start a line where from where the plane was last known, and then intersected it with the arc where the distance would have been correct at cruise speed with reference to the time.

Example with just some values. Since the arc radius and time was known, one would be able to draw a line which would show a constant speed. If it was not a constant speed, the line would have to bend left/right to account for it, which does not appear to be the case in the provided image.

satellite example

This is based upon the following:

  • 'A signal was sent out every hour'. In other words, they got several data points.
  • Based upon that, they would have points for the arc radius at set times.
  • They might assume that the aircraft has a constant speed. Because of this, they should see if the data points lie on the a straight time, since the only variable is the distance.

I'm pretty sure that the two lines is based upon the fact that they know the uncertainty at the final position, and in my opinion it suggests that the aircraft flew a constant course from the last known radar fix where it originates.

$\endgroup$
7
  • 2
    $\begingroup$ The only problem with this approach is that it assumes that the aircraft flew straight the entire time, and we have no reason to believe that this is the case. $\endgroup$
    – Lnafziger
    Commented Mar 19, 2014 at 21:23
  • $\begingroup$ and how do you explain that they have two possible paths, which seem to almost converge at the top ? $\endgroup$ Commented Mar 19, 2014 at 21:26
  • $\begingroup$ even if you have one fixed point where the plane was last seen by radar, how do you know which direction to draw the straight line to intersect the arc? There are infinitely many such solutions. You need some boundary conditions. $\endgroup$ Commented Mar 19, 2014 at 21:33
  • 1
    $\begingroup$ @MartinVegter imho, the increase in the distance increase between the lines from malaysia is pretty constant if you were to extrapolate the line. The difference might be caused by the uncertainty in the satellite instruments where it was last seen. $\endgroup$ Commented Mar 19, 2014 at 22:20
  • 1
    $\begingroup$ @user1968963 yes, of course, but the article states that there was a signal every hour, so they should be able to estimate the speed, and with the time to distance to get the intersection point :) $\endgroup$ Commented Mar 19, 2014 at 22:21
4
$\begingroup$

I provided a potential mathematical solution on deriving the flight paths using the ACARS data on 17 March (before the possible flight paths were published by the authorities) on CNN's iReport: http://ireport.cnn.com/docs/DOC-1108312

The key to finding MH370 without the aid of the transponder data but with regular attempted ‘handshakes’ from the ACARS satellite is by a process known as “vector addition”. If the last handshake with the ACARS satellite took place at 8.11am as reported then depending on the frequency of the previously attempted handshakes (half hourly or hourly, there seems to be some discrepancy in the reported frequency) a set of flight route models can be easily constructed giving a high probably of the final location based on the accurate last known location at 2.40am. Therefore, depending on the frequency of the ACARS handshakes there should be at least 6 and up to 12 vectors that could be mathematically solved.

Assuming a constant speed for the first probability model, each time the ACARS handshake occurs it gives only a footprint angle on the Earth (as has been shown on the reported 8.11am ACARS ping map; 40 degrees). The next time it handshakes another angle is indicated. At a constant speed only two possible headings are possible to ‘join’ the ACARS isogons (for the plane to get from one ‘angle’ to another). If MH370 was heading in generally the same direction or arcing across the sky, (even if there was some tacking back and forth like a yacht) only one of the possible vector solutions will be valid.

If the vectors from the last known location at 2.40am were systematically added together the final solution at 8.11am will bisect one of the two arcs provided by the authorities. Subsequent models at different average speeds and taking into account routes that would more effectively avoid radar detection would refine the models to a few high probability scenarios and narrow down the search area considerably.

It’s simple mathematics but there is no indication the authorities are using it.

As RedGrittyBrick has pointed out this is almost definitely how the flight path was estimated. The reason for the two flight paths is probably illustrating the two end member solutions based on the accumulated error using this technique (the more times you add one vector to another the more error can be introduced). Hence the two predicted flight paths diverge.

The reason for the confidence by the authorities in the southern Indian Ocean route is that the mirror set of solutions would need MH370 to pass straight over India and Pakistan; and they have emphatically denied this could have taken place.

Therefore there is the highest probability that MH370 ended up in the region of the southern Indian Ocean they are currently searching.

I am somewhat saddened that these probability models were not derived within days MH370 went missing and that at least 7 days were wasted searching in other areas.

$\endgroup$
1
$\begingroup$

The short answer is they don't know these are the final tracks for MH370 at all.

The two lines more likely represent a range of probability between them defined either by variablities in aircraft cruise speed or variabilities from cumulative calculation errors.

Plotting these paths with such certainty requires the last known position of MH370 to be known with certainty, but it isn't.

Whilst the "vector addition" method is not the same as another navigation practice known as "dead reckoning" there are striking similarities such as the amplification of track errors. The entire process is founded on a string of assumptions all of which have to be correct for the final solution to work.

There is good reason to question the credibility of these assumptions:

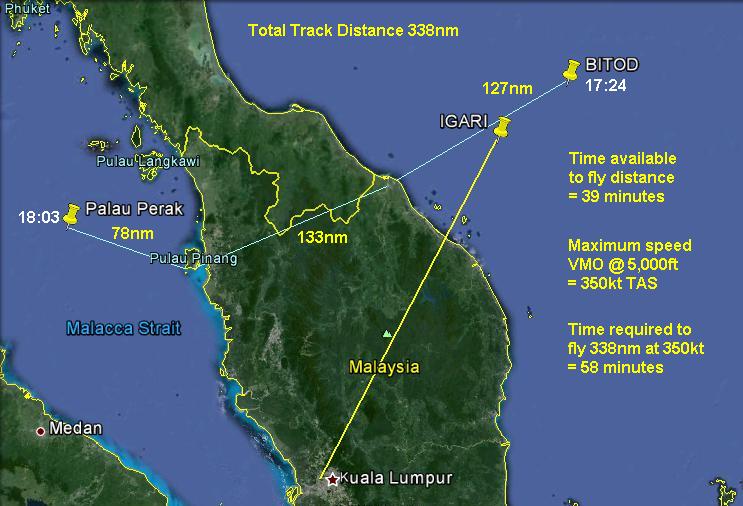
enter image description here

The problem with this carefully plotted track is it assumes the last position of MH370 above Aceh at 2:22am is known with certainty. That is not the case at all. Malaysian evidence for MH370's last position is increasingly discredited. It is even questionable whether MH370 was in the Straits of Malacca at all?

Radar track UAE343 overlay

For example the alleged Butterworth radar image does not show the tracks of two other aircraft known to be in the same area at the same time. Why not?

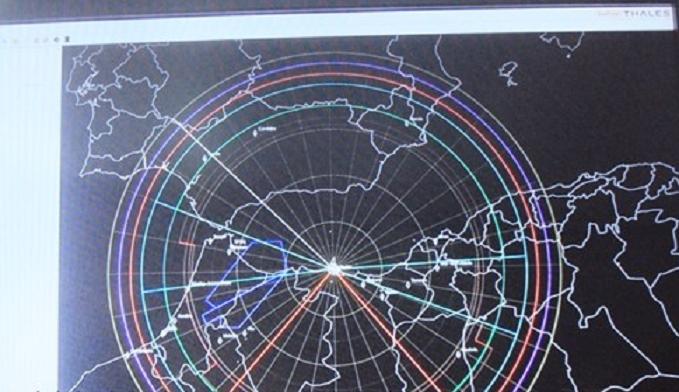
Another credibility problem is that Malaysia says the image which it showed to relatives at the Lido hotel on 21 March was from a military radar at Butterworth. In reality that radar is a Thales Raytheon GM400. This image is from a real Thales Raytheon GM400 display screen:

Thales Raytheon GM400 display screen

The alleged radar image which satellite track plotters have relied upon is this from the Lido hotel on 21 March:

Lido Hotel image

The alleged radar image from the Lido hotel is actually the screen-shot taken from a civilian SSR radar. That being so it could not be an image of MH370 because as we are told ad nauseum, is that MH370's transponder was not working. No SSR radar could have tracked an airliner without a transponder.

The credibility of Malaysia's radar image is so low that it is not unreasonable to call the image a hoax. They can't accurately plot the track of MH370 into the Indian Ocean based upon questionable radar claims like these.

Sadly another $90 Million taxpayer dollars will be wasted before people dare to question the Voodoo theology behind these calculations.

$\endgroup$

You must log in to answer this question.

Not the answer you're looking for? Browse other questions tagged .