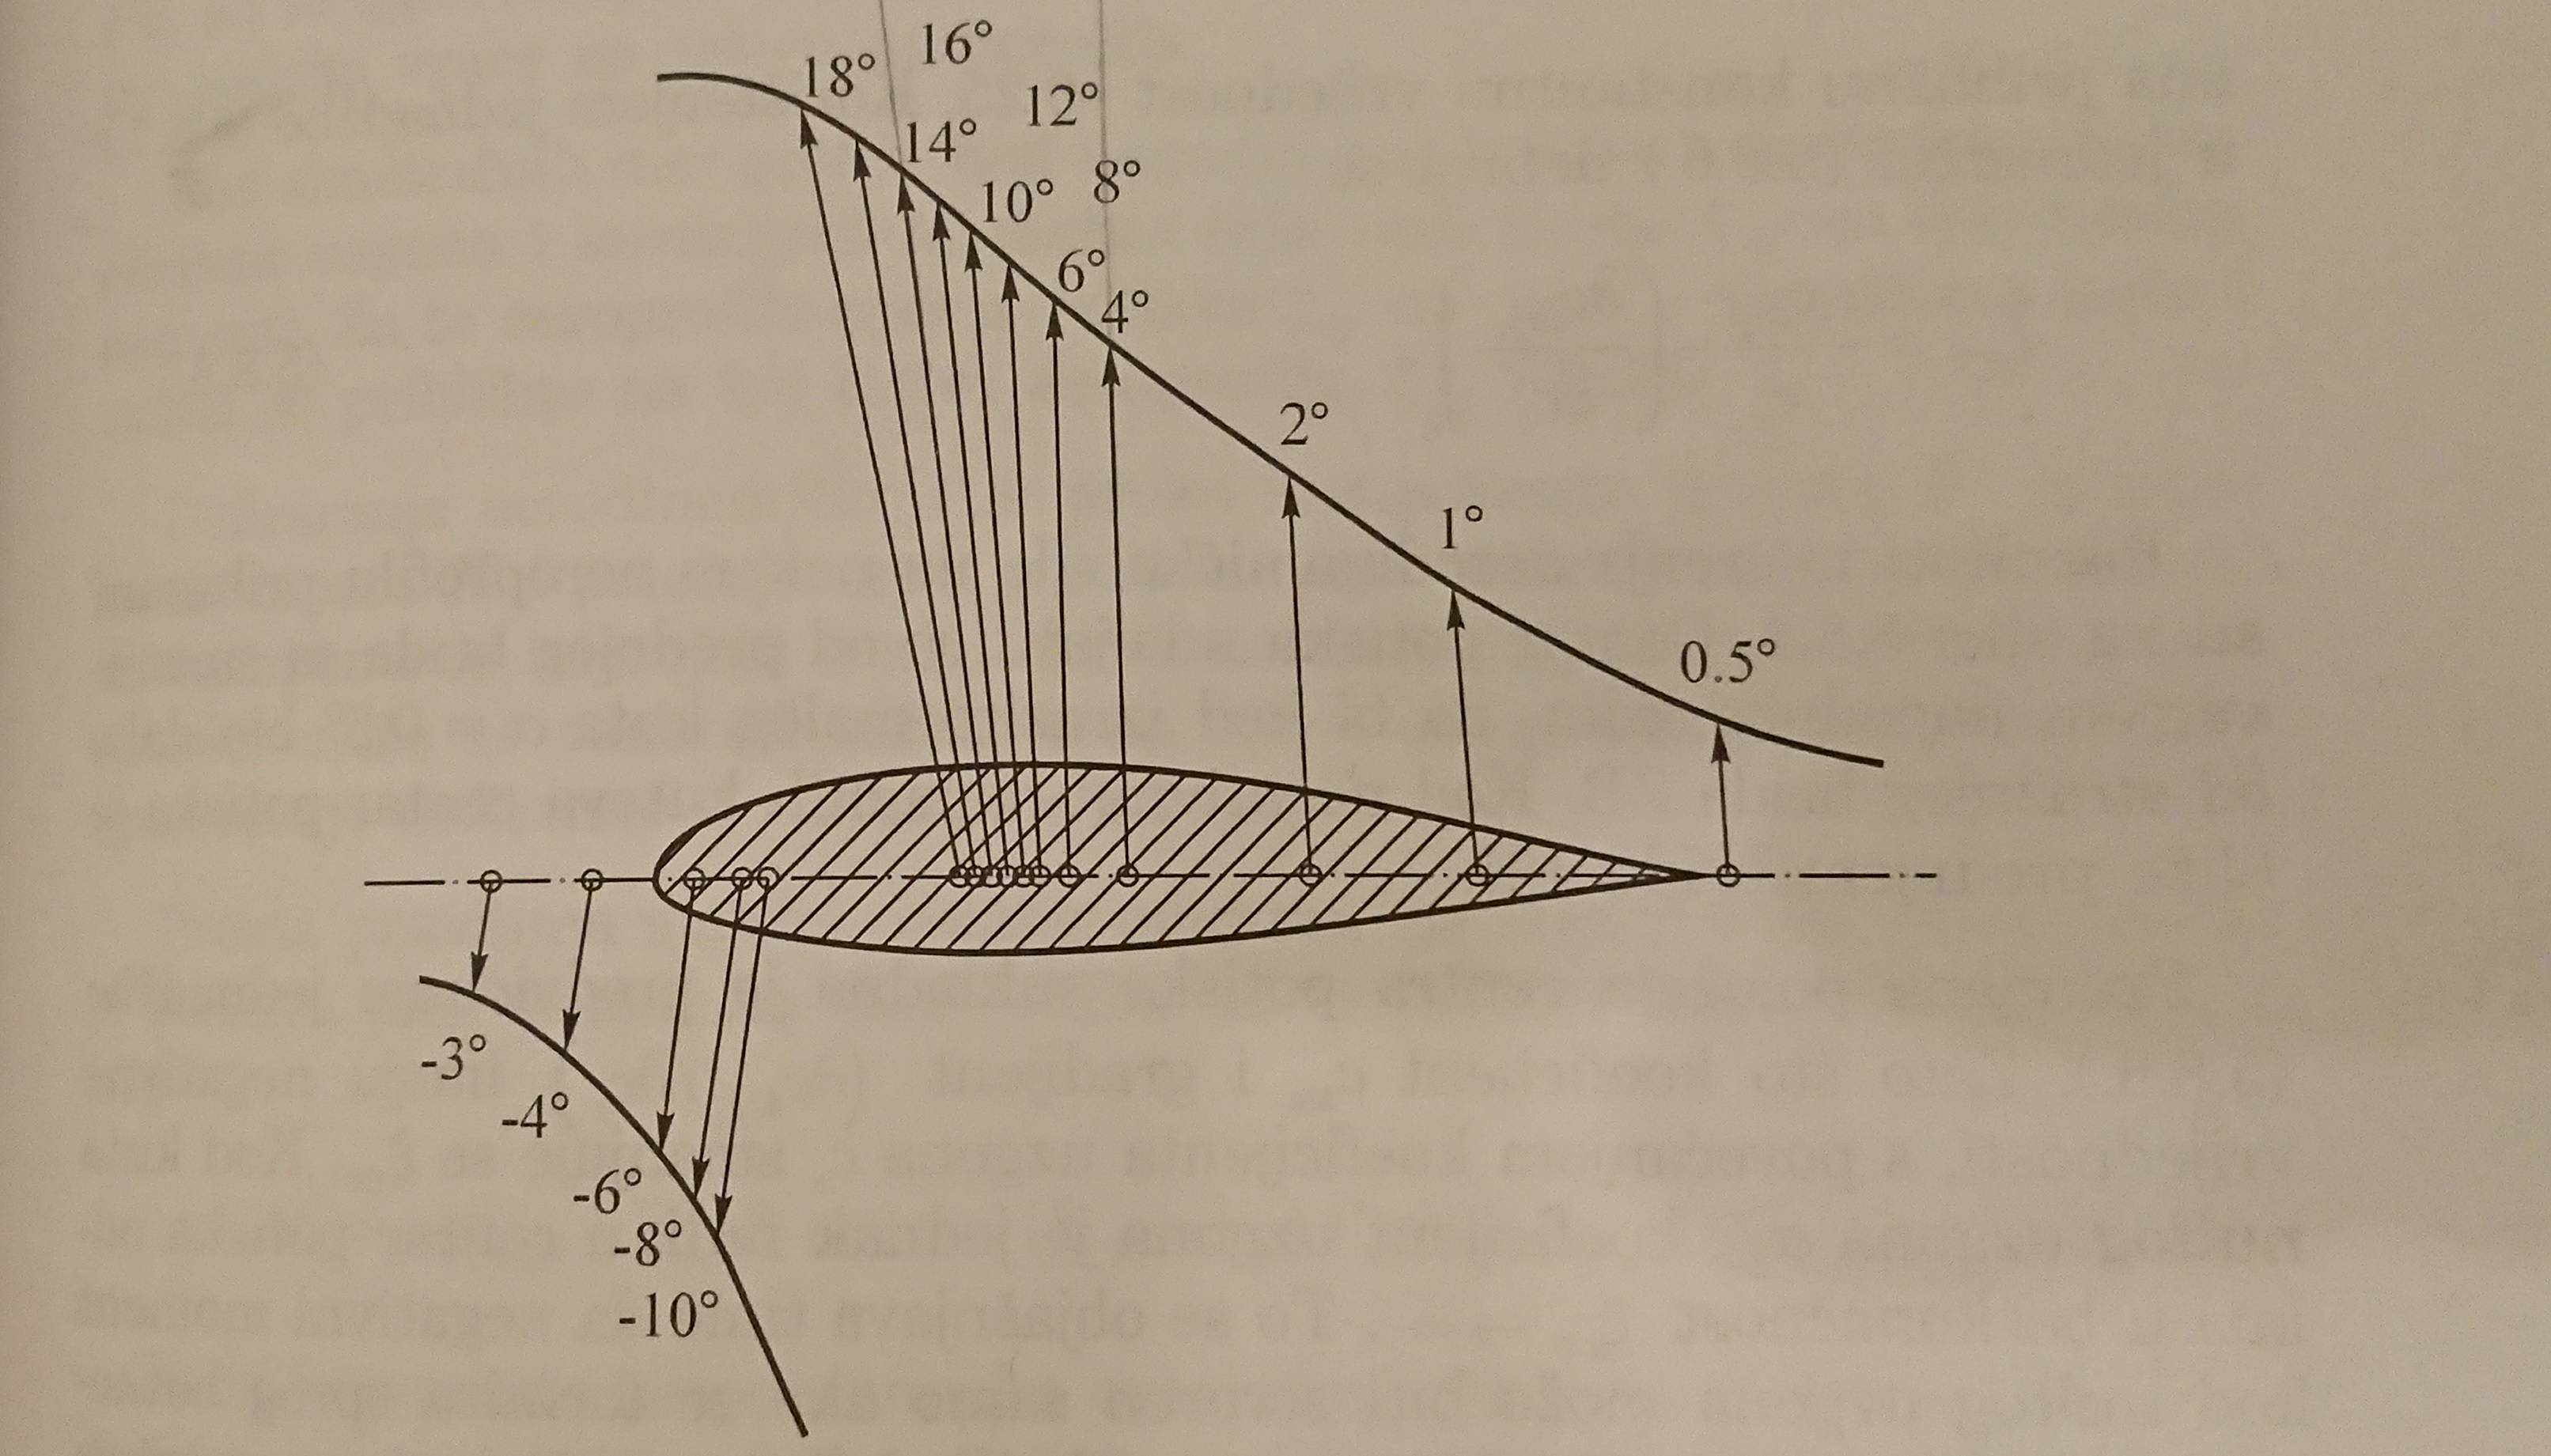
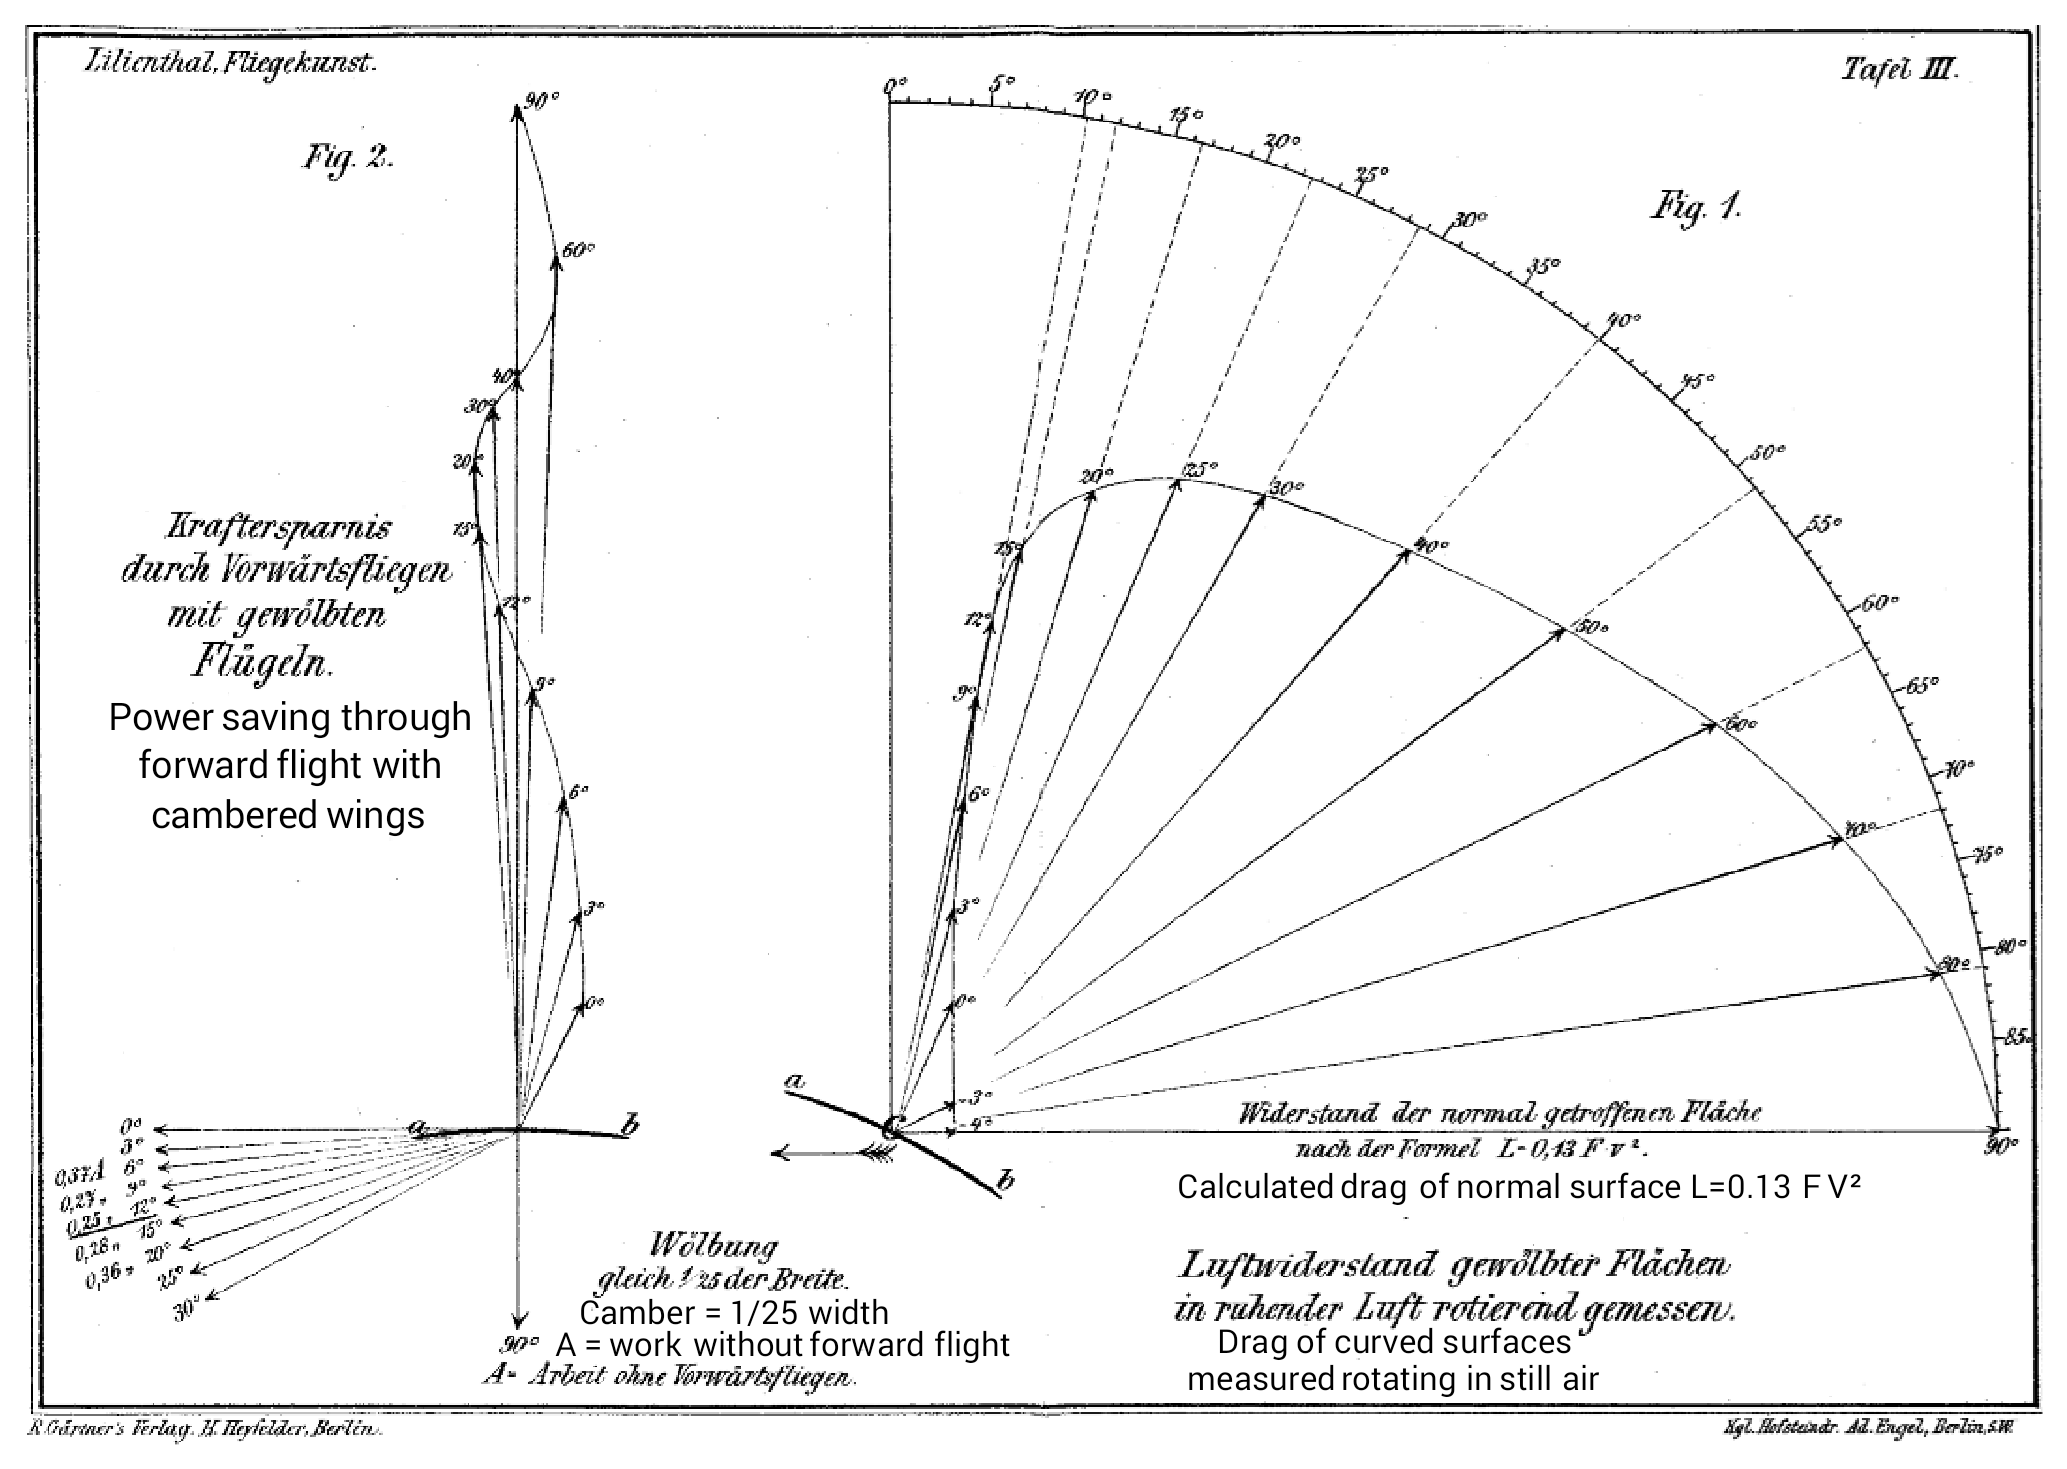
The top picture is from Otto Lilienthal's book "Der Vogelflug als Grundlage der Fliegekunst", published in 1889. The two diagrams are a polar plot of the resulting aero forces for several angles of attack, and the polar angle is measured relative to a line which stands orthogonal on the airfoil chord. This plot type is the reason why we still call a plot of an airfoil's lift and drag a polar plot even when using Cartesian coordinates.
Fig.1 shows the angle of attack on its outer arc and the resulting force vector hits this arc at a lower angle for AoA < 40°, showing that there is some forward component of the resulting force relative to the orthogonal on the chord line of cambered surfaces. This angular difference is singled out in Fig. 2 where the arc of Fig. 1 is collapsed into one point such that the fan of vectors allows a direct comparison of their direction. Between 15° and 20° AoA this forward component reaches its maximum.
The results were obtained by rotating wing models around a vertical axis. Those models had a low aspect ratio, so their stall angle is quite a bit higher than what you read today from a wind tunnel test where an infinite aspect ratio is simulated.
Today's plots don't show a resulting forward force component anymore because we define lift as the component orthogonal to the direction of flow and drag as the parallel component, plotting one on the Y-axis and the other on the X-axis of a Cartesian system. Lilienthal only plotted the resulting force and used the orthogonal to the chord line as the reference for the polar angle, so you would need to split the forces in the diagram by use of the cosine of the angle of attack for lift and the sine for drag. But converting a given table of lift and drag coefficients is easy with a spread sheet, so you can generate as many of those plots by yourself, if you like.
The lower plot shows the lengthwise drift of the center of pressure over angle of attack, with resultant aerodynamic force vectors added. A similar plot can be found here, only that the angle of attack varies over span so the local center of pressure for each section shifts back with increasing wing station as long as lift is positive and for negative lift approaches the wing from infinitely far forward.
This kind of plot shows the resulting aero force acting at a point where it is free from any moment. The direction of the vector is again orthogonal to the chord line and shows how much in-plane force component exists at high angle of attack before the airfoil stalls.


