What you really need to do this analysis is a detailed propeller map and a detailed engine map. Then you can do some analysis to match them together and make your own combined map.
Piston engine maps are often included in POH or other aircraft documentation, you can probably find one for your IO550D fairly easily.
Prop maps are much harder to come by. However, you may be able to obtain one by contacting the company.
Although I use the word Map -- implying a piece of paper with a chart on it, it could also be provided as a table of numbers -- or these days as a computer program that performs interpolation between points of an internal table of data.
Edit to discuss chart linked to by OP in comments.

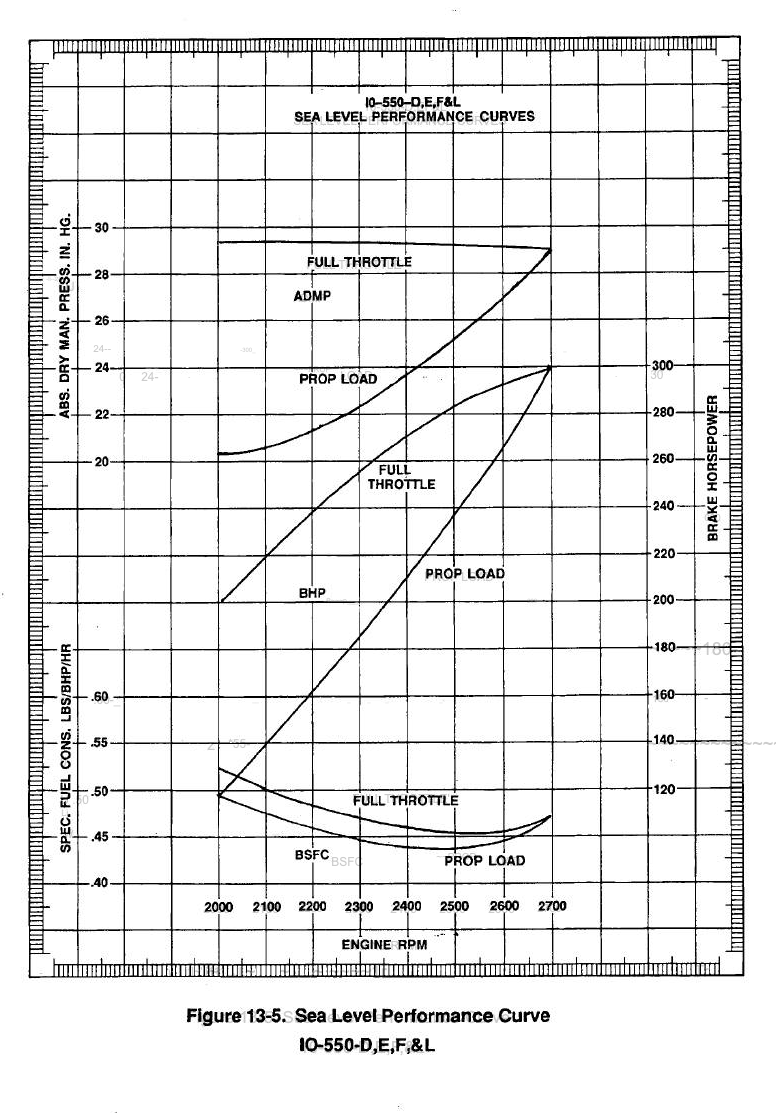
This is a simplified performance chart for this engine -- the important thing about this chart (that is not explicitly stated) is that it is for performance with a (particular) fixed pitch prop attached.
A different style of presentation would be used with a constant speed prop.
At the top of the page, the altitude is specified. This chart is also for a specific airspeed -- but unfortunately, that is not indicated anywhere I can see on this page.
The bottom two curves use the vertical scale at the lower left for BSFC. The middle two curves use the scale at the right for BHP. The top two curves use the scale at the upper left for manifold pressure.
All of these quantities are plotted as a function of RPM (the x-axis).
There are two curves because one represents the engine's performance at full throttle. The other represents the engine's performance with a fixed pitch propeller attached (at sea level and a particular airspeed).
The full throttle line represents the maximum operating capability of the engine -- in this case, it looks like it is mainly operating at about 29 inHg MP. If it were attached to a brake in a dynamometer, these are what the power and fuel flow curves would look like as RPM is varied.
However, the chosen fixed pitch propeller can't absorb 240 Hp at 2200 rpm. Instead, at 2200 rpm, it only absorbs 160 Hp with the engine at 23 inHg.
If the pilot advances the throttle (say to 200 Hp), the engine will produce more power than the prop can absorb, so there will be an excess torque applied to the shaft, and the propeller will accelerate to a faster rpm -- until 2350 rpm.
The prop is the load applied to the shaft -- the engine is the thing trying to drive the shaft. They must always match RPM (or the shaft is broken). The torque in and out must also balance -- knowing that you can accelerate / decelerate when out of balance. Just like with forces.
For a propeller, we have the advance ratio $J$, it is a function of the true airspeed ($V$), the engine speed ($n$) (in revolutions per time, not radians per time), and the propeller diameter ($D$).
$$J=V/(n\,D)$$
In many ways, the advance ratio is like the angle of attack of a wing.
For a fixed pitch prop, the power coefficient is a function of the advance ratio. This is like saying the drag coefficient is a function of the angle of attack.
$$C_P=f(J)$$
There is also a thrust coefficient -- but I'm ignoring that for now. The thrust coefficient would be like the lift coefficient in this analogy.
For a variable pitch prop, the power coefficient is also a function of the blade angle. But this chart is for a fixed pitch prop.
$$C_P=f(J, \beta)$$
The power coefficient is dimensionalized to shaft power like this
$$P_{shaft}=C_P\,\rho\,n^3\,D^5$$
This is entirely analogous to dimensionalizing the drag from the drag coefficient like this
$$D=C_D\,0.5\,\rho\,V^2\,S_{ref}$$
So, in this chart, propeller performance is for a fixed pitch prop at a single altitude (i.e. density $\rho$), and a single airspeed ($V$).
Starting at low throttle (2000 rpm), we are at some $J$, which means a particular power coefficient $C_P$, which is then dimensionalized to our $P_{shaft}=120$Hp.
Advancing the throttle, each point is for a different advance ratio $J$, which means a different power coefficient, and a different shaft power.
If we were to change the airspeed (say faster), the advance ratio would change (increase) at a given RPM, so the $C_P$ would change (decrease - I haven't shown a $C_P vs. J$, but trust me). And so the power absorbed by the prop would decrease. Since the pilot did not change the throttle, the engine's output power now exceeds the propeller's absorbed power and the prop will accelerate -- we've put the airplane in a dive and may over-speed the prop.
A different airspeed would be represented by a different set of prop load curves.
Likewise for a different altitude, or a different propeller.

