0
$\begingroup$

It's hard to appreciate an aircraft's rates of change in altitude, in particular with respect to its travel through the mass of air, rather than over the ground, since the latter is affected significantly by wind-speed (the distance an aircraft travels with respect to the ground is highly variable, compared to the distance it travels with respect to the air around it).

Then, when climb profiles are plotted, it's always on a graph with a hugely compressed horizontal axis (naturally, because it's hard to discern much information when one axis is a thousand times longer than the other).

Finally, when climb/descent rates are given they are usually in vertical distance/minutes, which is useful from an aviation point of view, but hard to compare with a vertical distance/horizontal distance measurement, or for example the familiar gradient figure that would be used to describe the slope of a road.

So, assuming absolutely still air throughout a flight, what might the altitude profile as plotted against distance look like, for a typical airliner on a flight long enough to be at cruising altitude for a few hours?

And, what sort of gradients would be represented for its climb after take-off and its descent towards its destination?

$\endgroup$
5
  • 2
    $\begingroup$ I can probably add some info later, but in the meantime - why don’t you convert one of the climb profiles you have into a diagram with a common axis scale for the visualisation you would like to see? $\endgroup$ Commented Jul 22, 2018 at 14:29
  • $\begingroup$ If I have to assume "absolutely still air throughout a flight" the plot given by any online flight tracker answers your question. The problem in what you ask is that unless you are equipped in recording the wind conditions throughout a flight, you will never be able to reconstruct what you seek. $\endgroup$
    – Federico
    Commented Jul 24, 2018 at 8:00
  • $\begingroup$ @Federico Since aircraft are equipped with both altimeters and airspeed indicators, this information must exist. I'm pretty sure pilots have an idea of the figures, for example. And clearly the information I'm after will not be available by looking at online trackers, which are a complete red herring here. I'm not interested in reconstructing information from some particular set of data, I'm asking about what a typical example might look like. $\endgroup$ Commented Jul 24, 2018 at 9:03
  • $\begingroup$ Daniele, may I suggest you pass by in chat? I am not sure I follow you, and if the discussion drags on it is better to have it in chat. $\endgroup$
    – Federico
    Commented Jul 24, 2018 at 9:07
  • $\begingroup$ I have written here what I do not understand Please join $\endgroup$
    – Federico
    Commented Jul 24, 2018 at 10:04

3 Answers 3

3
$\begingroup$

It is somewhat unclear what you want to achieve.

If you want to know how it looks like, you can search for some papers like this. To keep it short, altitude vs distance curve is pretty much similar to altitude vs time, but climb and descent segments are more curved with larger second derivatives for climb and descend. For details please read the paper.

If you are interested in some analysis, you need two components: flight data itself and data analysis software.

If you are looking for professional flight data analysis systems, for example, flightDataServices, generally they are not provided for free, but even if you have an access, you still need flight data for analysis. It can be more difficult to find it. If that is what you are looking for, just google "Flight Analysis Software" and "Flight Data".

You can do that analysis by yourself though, with a little less accuracy than a professional system. The closest option for getting an accurate flight data is FlightAware.com. They do not provide altitude vs distance out-of-the-box, but they provide plenty of data for further analysis. For example, this flight. You can open track log and see altitude/speed vs time (which is not you are looking for, but useful for a 'big picture'), and in the log itself you can find latitude, longitude, speed and rate of climb for some points. The points are provided with a less-than-a-minute frequency, which is pretty precise. It is not so hard to export them in any spreadsheet or CSV and generate whatever you are interested in: a pretty common data visualization task. It can be easily done with Matlab/Excel/LibreOffice. For example, altitude vs distance travelled, course vs time, rate of climb vs time, rate of climb vs distance etc.

If you are looking for data visualization software specified for flight analysis, I am not sure that something exists that fits all requests. Especially an online tool. The reasons are: flightaware provides both data and the most common plots (i. e. alt vs time and speed vs time); and if you already have data, it's pretty easy to plot whatever you want using Matlab/R/Python/Excel.

$\endgroup$
7
  • $\begingroup$ Well, it doesn't include data for altitude/distance, which is what I'm concerned with, so no, unfortunately it doesn't provide the most basic thing I am asking about. It provides data instead for altitude/time (which as the question points out is readily available but not what I am looking for). $\endgroup$ Commented Jul 22, 2018 at 21:21
  • $\begingroup$ It provides latitude and longitude, and speed. You can copy that data to any tool (even Excel) and plot altitude/distance. $\endgroup$
    – avtomaton
    Commented Jul 22, 2018 at 21:55
  • $\begingroup$ That would a) be quite a lot of work in itself, for something that I hoping to find exists already b) would be very hard to do accurately taking into account the fact that aircraft typically make multiple turns particularly in climb and descent phases, and c) fails to take into account that it's distance through air, not distance over ground, that the question is concerned with. $\endgroup$ Commented Jul 23, 2018 at 7:04
  • $\begingroup$ Yes, it is a little bit of work in itself, copy, paste to any spreadsheet and make 4-5 mouse clicks after that to create a diagram. And about all other points... You have a horizontal and vertical profiles with latitude and longitude in a track log. What distance through air are you talking about? Lat-log are ground references! All turns of airliners are usually very shallow, and positions in a track log are given at least once a minute. Pretty accurate for computation. $\endgroup$
    – avtomaton
    Commented Jul 23, 2018 at 9:33
  • $\begingroup$ Please read the question again. I know you are trying to be helpful, but I spent quite a bit of time formulating the question to specify what, exactly, I was trying to find out. Possibly I didn't express it as clearly as I'd hoped, and thank you for trying to answer, but the information you keep trying to tell me about is not the information I am seeking. I don't think you have understood the question. $\endgroup$ Commented Jul 23, 2018 at 15:11
1
$\begingroup$

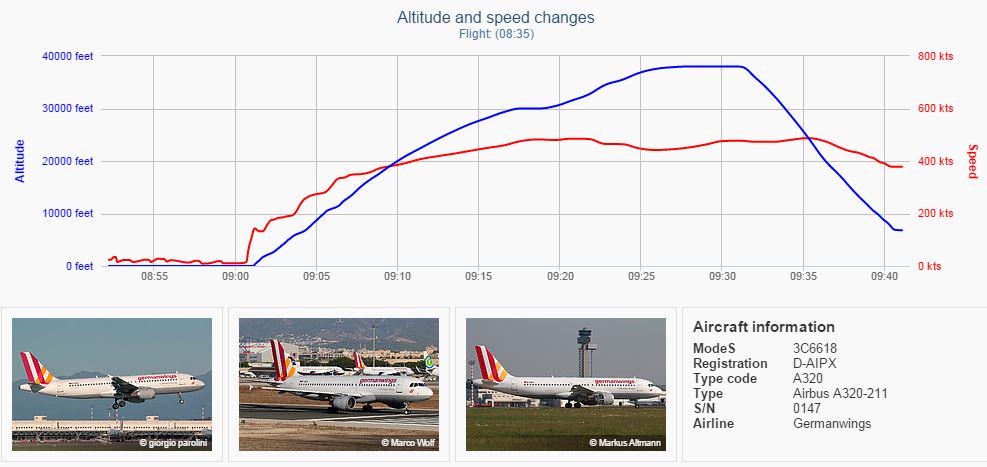
Here is a flight profile graph that shows altitude plotted against time, as you mention is often the case, but it also includes airspeed which gives distance traveled through an air mass as you require. Airspeed can be used to stretch/squeeze the x axis of the altitude diagram to show distance through the air instead of time, and this changes little once the aircraft is above 20kft.

If you assume the x axis is ~400kt, the climb phase at ~200kt would squeeze it by half.

enter image description here

$\endgroup$
1
  • 1
    $\begingroup$ Are you sure this graph is airspeed and not ground speed? $\endgroup$
    – Sanchises
    Commented Jul 15, 2021 at 7:26
1
$\begingroup$

What would the profile “look like”? Well, if you were to graph it, it would be very, very long and skinny... (there is a reason why vertical scales are typically exaggerated)

That might sound snarky, and I know you think you put a lot of thought into the careful wording of your question, but it is very broad as stated: What are you really looking for in an answer, the general appearance of the profile when plotted with vertical and horizontal scales equal? The climb or descent gradients expressed in degrees? Or rise/run slope? What units of measure would you like the answer to be in?

And what is a “typical” flight? (2 hours of cruise, or 12 hours of cruise?!)

I know you said you don't want to crunch actual data, but I think the suggestions here are sound if you are looking for typical. Any effects of wind will average themselves out as you increase your sample size. And there are other variables that have as much or more effect on the climb gradient.

However, if you are looking for a ballpark answer, here is my shot at giving you some additional perspective:

Climb - Airliners don’t typically target a vertical speed in the climb because doing so will cause airspeed to gradually decay. Instead, a climb airspeed is set, making the vertical speed a continuously changing variable. And that vertical speed will vary depending on aircraft type, the load, and whether a fuel efficient cruise climb is chosen, or a higher performance climb rate for terrain clearance. (so again, no such thing as “typical”…)

Cruise - Get a long piece of graph paper because "the altitude profile plotted against distance" for 4 hours at 300 knots at 30,000 feet will be 243 horizontal units for every vertical unit. (This is obviously just an example, you may scale appropriately depending on altitude and duration of flight)

Descent - This is probably easiest to define/predict for “typical”, and there are a few different ways to figure out what a descent profile might look like:

  • Vertical speed: For passenger comfort the flight might target 1500-2000 FPM down depending on airspeed and altitude. At 250 knots, (speed limit below 10,000’) and 1500-2000 FPM rate of descent, the gradient would equate to 13-17 units horizontally for every unit vertically.
  • The Flight Management System may be programmed to calculate a default 3 degree descent for the autopilot to follow, and most approaches are about 3 degrees. So, 3 degrees is probably a good descent angle to use for typical.
  • The Flight Management System on larger airliners typically calculates a descent based on a descent speed profile, which then results in a varying descent angle and vertical speed, just the climb section described above.
  • Finally, for rough planning pilots us a 3:1 rule of thumb for descents. This means that for every 3 nautical miles you should plan to lose 1000 feet. This equates to a ratio of about 18 horizontal units for every vertical unit.

I hope this helps.

$\endgroup$
3
  • 1
    $\begingroup$ @Bianfable, Thanks for that perspective. My experience is limited, but in the Dash 8 Q-400 I am currently training in we either follow a VNAV path, or target VS. If you would like to suggest an edit or convert your numbers into a descent gradient I would be happy to add the info to my answer... $\endgroup$ Commented Jul 15, 2021 at 18:05
  • $\begingroup$ @Bianfable, I tweaked my answer a little in the descent section, please let me know if you have any suggestions. $\endgroup$ Commented Jul 15, 2021 at 18:35
  • $\begingroup$ I added another bullet to the descent section to cover my points from the comments. $\endgroup$
    – Bianfable
    Commented Jul 15, 2021 at 18:42

You must log in to answer this question.

Not the answer you're looking for? Browse other questions tagged .