7
$\begingroup$

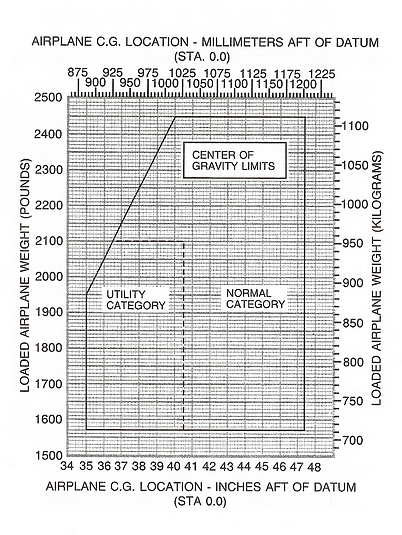
In a chart like the one below, limitations on the max aircraft weight (upper horizontal line), forward-most CG (left vertical line), and aft-most CG (right vertical line) are fairly easy to understand. However, other limitations can be present as well, such as the diagonal line that cuts off what would be the top-left corner below, so as to disallow some forward CG's at heavier weights that would be okay when lighter.

example CG chart Source

At a conceptual level, what drives limitations like this diagonal line? What adverse state does adhering to this limit protect against?

$\endgroup$
1
  • 1
    $\begingroup$ The additional offset of the cg must be balanced by additional negative lift of the elevator, which would decrease total lift. $\endgroup$ Commented Apr 27, 2023 at 14:42

2 Answers 2

7
$\begingroup$

The "aircraft C.G. location" is indeed the C.G. location of the loaded aircraft.

At some given (constant) speed for final approach, in the "cut off" upper left hand corner of the chart the aircraft runs out of elevator authority for the landing flare.

Related links:

https://www.pilotsofamerica.com/community/threads/weight-and-balance-gurus-enter-in.120993/

$\endgroup$
2
  • 1
    $\begingroup$ Also, stick forces may become excessive in a reversible control system. $\endgroup$ Commented Apr 27, 2023 at 17:01
  • 2
    $\begingroup$ The Piper Seminole light twin suffered from that problem, the pitch forces becoming unpleasantly high in the flare with only two aboard and trimmed for normal approach speed. You could cheat it by adding more nose up trim just before you were about to flare, but you left yourself exposed if you had to go around and now you were frantically retrimming ND. $\endgroup$
    – John K
    Commented Apr 28, 2023 at 3:33
4
$\begingroup$

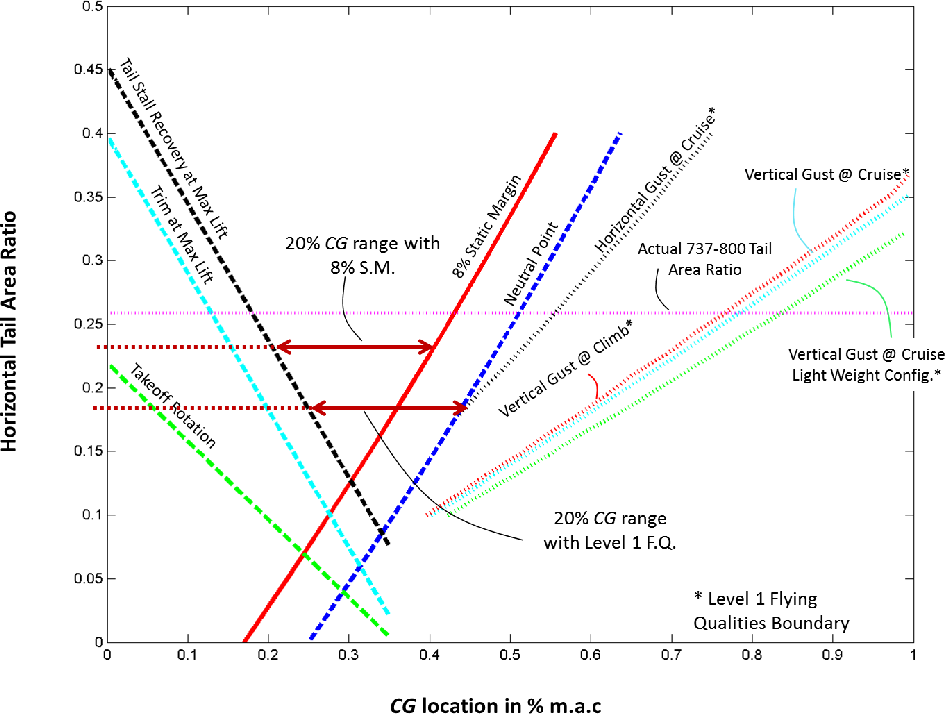
When designing an aircraft -- specifically sizing the horizontal tail and elevator -- we use an 'X-Plot' or a 'Scissor Plot'.

This plots tail size (often as volume coefficient) on the Y vs. CG position on the X, with several slanted vertical lines, each representing a requirement for the tail. These requirements later become these CG envelope limits.

Anything that might represent a limit of tail size or elevator size can become one of these limits.

Having sufficient control authority to rotate on takeoff.

Having sufficient control authority to stall on landing.

Having sufficient trim authority to trim throughout the flight envelope.

Some sort of nose-down control limit.

Aft-cg stability limit, fwd-cg stability limit.

Here is an example:

enter image description here

Pulled from this paper.

When sizing the tail, you can imagine taking a horizontal bar with the desired % CG range and dropping that into the gap between the constraints. In the case of a 20% desired range, the tail area ratio in this plot is 0.23. However, if we required a 30% CG range for some reason, we would need a larger tail - about 0.27.

$\endgroup$
3
  • 1
    $\begingroup$ Your plot and answer shows horizontal tail area vs. CG but the question is about weight vs. CG $\endgroup$
    – sophit
    Commented Apr 27, 2023 at 17:07
  • $\begingroup$ Indeed -- typically the constraints are the same on both plots. One is used during the aircraft design process. The other is used operationally after the size of the tail is fixed. I was trying to give a list of constraints that apply to the CG position -- as well as a bunch of keywords and context that may be searched for further research. $\endgroup$ Commented Apr 27, 2023 at 17:36
  • $\begingroup$ Then you should maybe better highlight the connection between the limitation on the weight and the limitation on the tailplane surface. $\endgroup$
    – sophit
    Commented Apr 27, 2023 at 18:08

You must log in to answer this question.

Not the answer you're looking for? Browse other questions tagged .