For an unpowered glider, can we show through simple geometry involving force vector diagrams, rather than mathematical formulae or graphs, that the best still-air glide ratio is achieved at the angle-of-attack that gives the maximum ratio of Lift to Drag?
-
1$\begingroup$ That's a pretty tall order for engineering types lol. $\endgroup$– John KCommented Oct 20, 2020 at 14:36
-
$\begingroup$ Highly related: aviation.stackexchange.com/q/80731/4108 $\endgroup$– SanchisesCommented Oct 21, 2020 at 19:29
-
$\begingroup$ This one is also related, but a bit different-- aviation.stackexchange.com/questions/3610/… $\endgroup$– quiet flyerCommented Oct 22, 2020 at 12:07
-
$\begingroup$ Re "Highly related: aviation.stackexchange.com/q/80731/4108 -- had not come across that one before, and probably wouldn't have posted this one if were aware of it. Arguably not quite a duplicate because of the specification not to use formulae, but very close; answers to the present question will also fit that one. I would consider deleting the present question if there weren't already answers to it (other than my own). $\endgroup$– quiet flyerCommented Oct 23, 2020 at 12:50
-
$\begingroup$ We could consider "migrating" all answers to this question to the other one (aviation.stackexchange.com/questions/80731/… ) -- if all posters wish to post their answers there and delete them here, I will delete the question. However since we have an answer here with three upvotes already, that might not be a palatable solution to all... $\endgroup$– quiet flyerCommented Oct 23, 2020 at 13:04
2 Answers
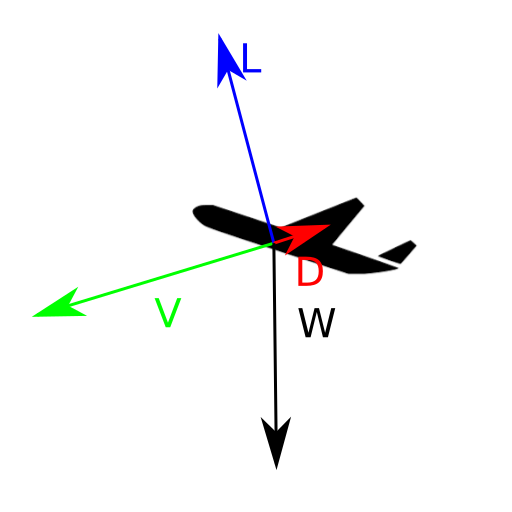
Let's start with a Lift/Drag/Weight diagram, and draw the velocity vector as well:
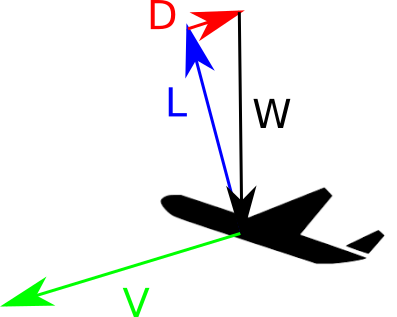
Since no thrust is involved, Lift+Weight+Drag must sum to zero. Let's shift the origin of these vectors around a bit:
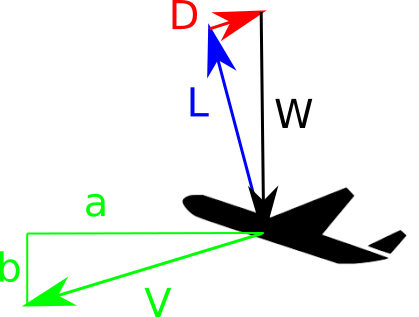
Now, let's finish the velocity triangle, drawing a (horizontal distance), and b (vertical distance). The ratio between a and b is by definition the glide ratio.
The key idea here is to notice that the triangles L-W-D and V-a-b are similar, that is, they are the same triangle up to a scale.
The similitude goes: W <-> v, D <-> b, L <-> a.
This means that the ratio between a and b is the same as the ratio between L and D. The latter is of course the Lift-To-Drag ratio.
So, in any condition, the glide ratio is the same as the Lift-To-Drag ratio. It then follows that the best glide ratio is achieved for the best Lift-To-Drag ratio.
-
1$\begingroup$ Please ignore the unrealistically high angle of attack, I used the first plane image I found on google search. $\endgroup$– sbabbiCommented Oct 21, 2020 at 19:18
-
$\begingroup$ your diagrams are excellent. Now, what is moving the glider horizontally? Consider an iceboat, being pushed by the wind from the side (glider sinking), yet moving forward faster than the wind (lift). Vertical drag (caused by altitude loss) is glider fuel. V min sink may have a lot to do with air pressure underneath the airfoil assisting lift, but pushing the plane forward more slowly. 100% agree with your rate of descent/ horizontal speed triangle. This is where Vbg is proven more efficient. (Your glider nose should be below the horizon). $\endgroup$ Commented Oct 21, 2020 at 23:31
-
$\begingroup$ The answer is perfect, exactly the same points that I was making, just nicer diagrams and more concise language. Obviously there are some unspoken assumptions built in-- for example, still air (as specified in the question). PS @RobertDiGiovanni I'm sure we can find some examples of an aircraft in an unpowered glide with a nose-up pitch attitude though it may not be the norm for efficient sailplanes. $\endgroup$ Commented Oct 22, 2020 at 11:58
-
$\begingroup$ Not to worry, the lift vectors are correct. $\endgroup$ Commented Oct 22, 2020 at 16:54
-
$\begingroup$ You might consider also posting this answer here aviation.stackexchange.com/q/80731/34686 . You might initially get a downvote or two for posting the same answer twice but in the long run it is a nice concise answer and likely will be appreciated wherever it goes. $\endgroup$ Commented Oct 25, 2020 at 16:15
First a caveat-- please keep in mind that this answer is focussed on steady-state linear gliding flight. Throughout this answer, when we talk about what happens when we change the angle-of-attack and L/D ratio, we're assuming that we've waited long enough for the glider to settle back into equilibrium at whatever airspeed is appropriate for the new angle-of-attack and L/D ratio.
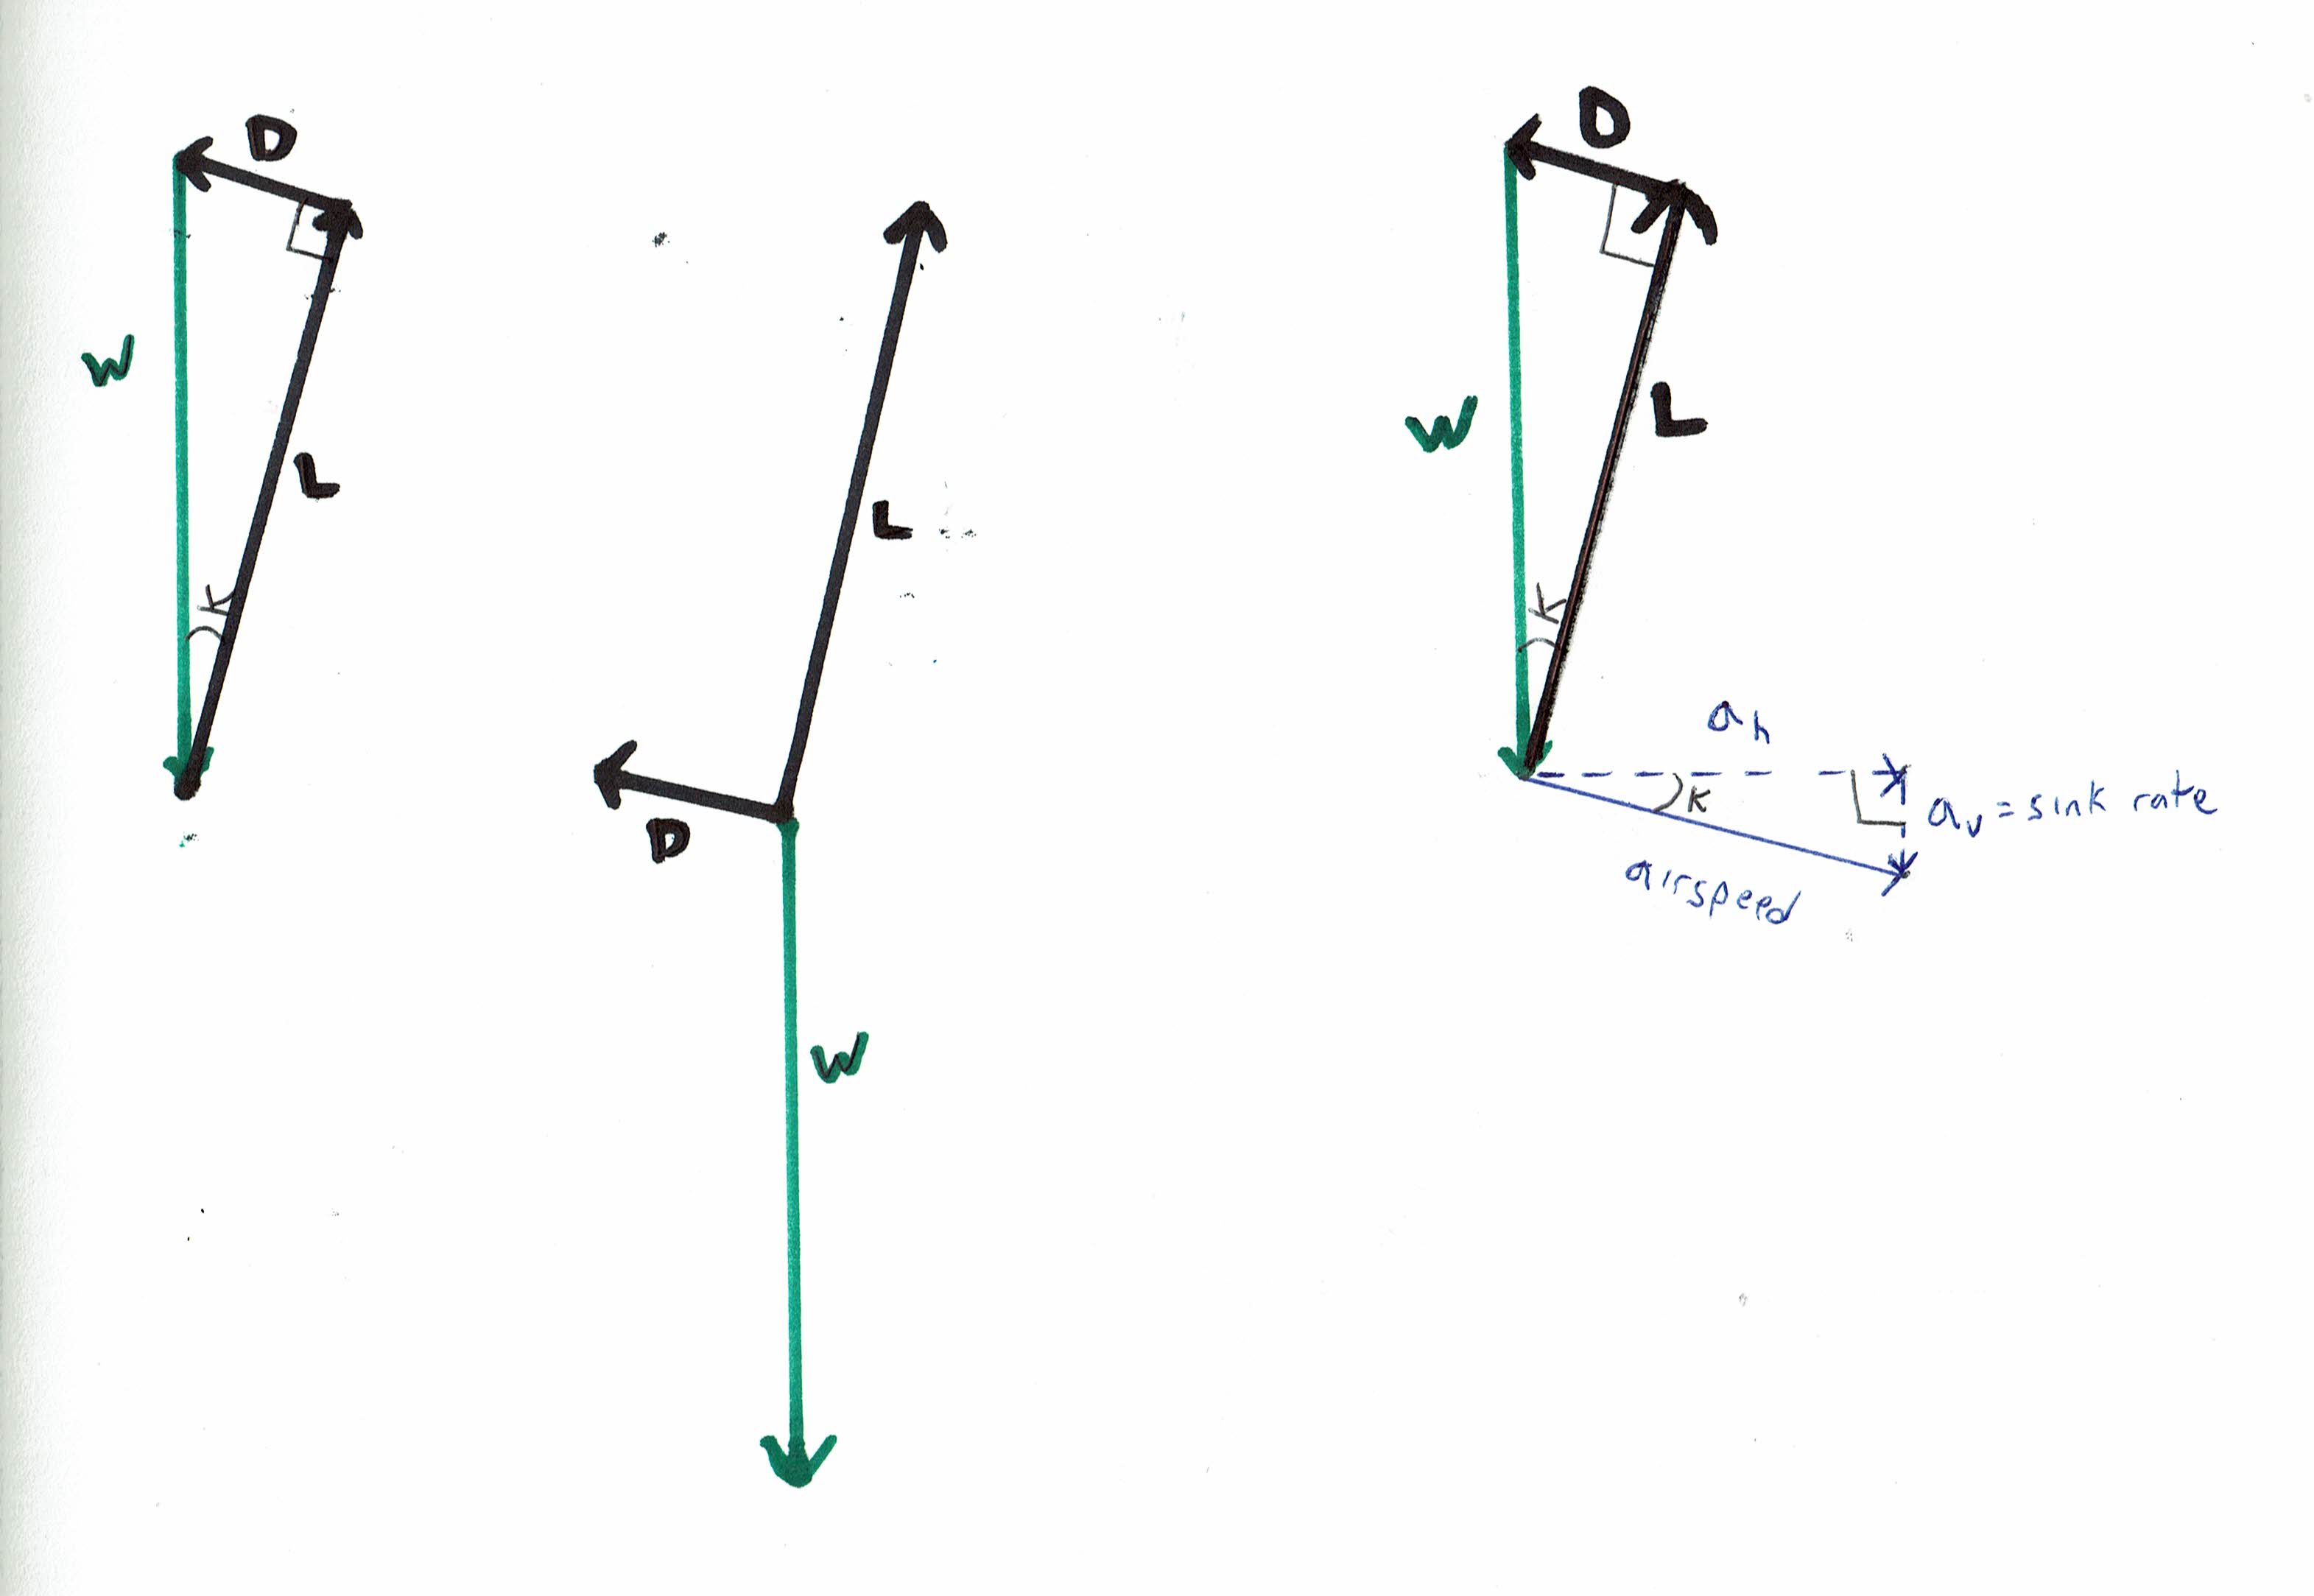
All three of the vector diagrams below represent the exact same physical situation-- sustained, steady-state gliding flight along a linear flight path in still air. We've represented the aerodynamic forces in black, and the gravitational force-- the weight vector-- in green. The left-hand and right-hand diagrams are easier to understand than the middle diagram, because the force vectors are arranged into a closed polygon (a triangle in this case), which shows us instantly that the net force is zero. On the right-hand diagram, we've also included the airspeed vector, and its horizontal and vertical components.
Lift is defined as acting at right angles to the relative wind, i.e. the undisturbed apparent airflow created by the aircraft's path of travel through the airmass. I.e. lift is defined as acting at right angles to the flight path through the airmass. Drag is defined as acting parallel to the relative wind, i.e. parallel to the aircraft's path of travel through the airmass.
Note that K is the glide angle, and note that on the right-hand diagram, the triangle formed by the force vectors and the triangle formed by the velocity vectors are similar triangles. This is why the still-air glide ratio -- the ratio of horizontal speed to sink rate in still air -- is identical to the ratio of Lift to Drag.
The still-air best glide ratio -- i.e. the best ratio of horizontal distance travelled to altitude lost in still air -- must coincide with the best ratio of Lift to Drag.
Note that in a steady-state glide, Lift is less than Weight by the same proportion that horizontal speed is less than airspeed. For many calculations, it is a close enough approximation to assume that Lift and Weight are the same, and that horizontal speed and airspeed are the same. However, our vector triangle is very sensitive to this distinction -- overlooking it forces our vector triangle to collapse into a straight line, which forces the sink rate to be zero and gives us a glide angle of zero, i.e. a glide ratio of infinity.
Also note that the geometry of the triangle is such that the maximum Lift to Drag ratio also coincides with the minimum Drag value, and the maximum Lift value.
Note that the minimum Drag value does not coincide with the minimum value of the Drag coefficient. The Drag coefficient is minimized at very low angles-of-attack, i.e. at very high airspeeds. So we need to be careful about what we mean when we say we want to minimize Drag in order to maximize the glide ratio. This is only true when we are speaking about Drag as an actual force, not as a coefficient. The same is true for Lift. While (for reasonably high L/D ratios) Lift varies much less than Drag as we change the L/D ratio, it is still true that in gliding flight, Lift is slightly higher at the point of max L/D ratio than at any other L/D ratio. But the Lift coefficient is not maximized at the point of max L/D ratio-- rather, it is maximized near the stall angle-of-attack. Yet in spite of all this, it is an arithmetic fact that when we maximize the L/D ratio, we also maximize the ratio of Lift coefficient / Drag coefficient -- even though we are not individually maximizing either the Lift coefficient or the Drag coefficient.
Warning: do not mistake the right-hand diagram for an indication that to minimize the sink rate, we simply need to minimize the drag vector. The force vector triangle and the airspeed vector triangle are geometrically similar, but they are not identical. As airspeed changes, the entire airspeed vector triangle scales up or down in size, while the force vector triangle is locked in size by the fact that the Weight vector is constant. If we miss this relationship, we may tend to assume that the minimum sink rate airspeed must coincide with the airspeed for minimum Drag, which is also the airspeed for the maximum L/D ratio. This is not the case-- as we'll see below, the airspeed for the minimum sink rate is lower than the airspeed for minimum Drag, which is also the airspeed for the maximum L/D ratio.
Every possible angle-of-attack of the wing is associated with a specific lift coefficient, a specific drag coefficient, and a specific Lift / Drag ratio. If we ignore effects due to changes in Reynolds number associated with changes in airspeed, we can make the approximation that the same angle-of-attack of the wing will always be associated with the same lift coefficient, drag coefficient, and Lift / Drag ratio regardless of whether the aircraft is heavy or light-- a change in weight is expressed as a change in the airspeed associated with any given angle-of-attack, but no change in the lift coefficient, drag coefficient, or Lift / Drag ratio associated with any given angle-of-attack. If we increase weight, any given L/D ratio-- including the maximum L/D ratio-- will now occur at a higher airspeed. The increase in airspeed will be proportional to the square root of the increase wing loading.
If the still-air best glide ratio occurs at the same angle-of-attack that gives the best L/D ratio, then it clearly follows that we can minimize the sink rate by increasing the angle-of-attack to slow down slightly, even if this degrades the the L/D ratio and the glide ratio a bit. In other words, if we fly more slowly down a slightly steeper glide path, we can minimize the sink rate. Obviously there is a limit to this process-- as we continue to increase the angle-of-attack and degrade the L/D ratio, then at some point well before we reach a full-blown stall, we'll reach a point where the increased steepness of the glide path is too much to be offset by the decreased airspeed, and the sink rate will start to increase again.
In fact, the highest L/D ratio occurs at the angle-of-attack that gives the highest ratio of Cl/Cd, while the minimum sink rate occurs at the angle-of-attack that gives the highest ratio of (Cl^3) / (Cd^2), which is also the highest ratio of ((L^3) / (D^2)) / airspeed. It's clear that when we want to minimize the sink rate, we gain more by maximizing the lift coefficient than by minimizing the drag coefficient, so we should choose an angle-of-attack that is somewhat higher than the angle-of-attack for the best L/D or Cl/Cd ratio. This means that the airspeed for the minimum sink rate is always slower than the airspeed for the best glide ratio in still air.
Vector diagrams like the ones included in this answer are surprisingly rare in books about soaring flight. Materials published by the FAA sometimes attempt to include such a diagram, but they are invariably badly botched, with the length of the various force vectors altered so that they could not possibly form a closed vector triangle, thus eliminating any possibility for the reader to understand the relationship between the force vectors and the glide ratio. (One might optimistically hope that they are trying to make the point that a glider is not always flying in a straight line with no acceleration?) (See for example figure 3-1 on page 3-2 of the FAA's "Glider Flying Handbook" (2013) -- here they've even included a Thrust vector!) Even a theory-rich book like "New Soaring Pilot" by Welch, Welch, and Irving (3rd edtion, 1977) is entirely lacking in any presentation of the Lift-Drag-Weight diagram for steady-state gliding flight. However, see page 233 of that book for a "polar curve" clearly showing that the max L/D ratio occurs at a higher airspeed than the minimum sink rate.
A couple of additional notes--
Our vector triangles also show that the maximum value of (horizontal speed / sink rate) and the maximum value of (airspeed / sink rate) both occur exactly at the maximum L/D ratio, so we can also find the airspeed for maximum glide angle by looking at the plot of (airspeed / sink rate) versus airspeed and picking the airspeed where (airspeed / sink rate) is maximized or (sink rate / airspeed) is minimized. Naturally, this will not be the airspeed for minimum sink rate. The airspeed for minimum sink rate will clearly always be lower than the airspeed for minimum (sink rate / airspeed).
Occasionally one encounters a suggestion that the best L/D speed or the minimum sink rate speed has something to do with the point where Induced Drag is minimized. The vector diagrams above demonstrate that as long as Weight is fixed, when we maximize L/D, we also minimize Drag. So at the best glide-ratio airspeed, where the L/D ratio is maximized, Drag is minimized. Since Induced Drag decreases with airspeed and Parasitic Drag increases with airspeed, it follows that at the point of max L/D -- i.e. at the point of minimum Drag -- half the drag must be Induced Drag and half the drag must be Parasitic Drag. This is the only point where Drag can be at a minimum. Clearly, the point of best L/D is cannot be tied to a minimum in Induced Drag or a maximum in Lift / Induced Drag. The ratio of Lift / Induced Drag is highest at very low angles-of-attack, i.e. at very high airspeeds.
For more on L/D ratios and gliding flight and powered flight, see this related A.S.E. answer, and other linked answers-- 'Gravitational' power vs. engine power
-
$\begingroup$ Comments are not for extended discussion; this conversation has been moved to chat. $\endgroup$– FedericoCommented Oct 22, 2020 at 6:43
-
$\begingroup$ This is a lot of text for a question asking for "simple geometry"... $\endgroup$ Commented Oct 22, 2020 at 16:52
-
$\begingroup$ @Sanchises -- the question is fully answered by the end of the fifth paragraph (third paragraph under the diagram), the rest addresses other topics of related interest. Do you think the answer would be improved by simply deleting everything after the end of the fifth paragraph? $\endgroup$ Commented Oct 23, 2020 at 11:19
-
$\begingroup$ @quietflyer I think it would but I thought It'd be rude to suggest :) Especially as you asked the question yourself, you probably know best what you wanted to know, and my preference for short & concise answer is definitely a personal one. (It wasn't my downvote here) $\endgroup$ Commented Oct 23, 2020 at 14:50
-
$\begingroup$ related-- derivation of why min sink occurs at max Cl^3 / Cl^2 -- aviation.stackexchange.com/a/82201/34686 $\endgroup$ Commented Nov 10, 2020 at 19:31


