Background
For academic research purposes, I have developed a first-principle takeoff performance model that returns a takeoff distance required (TODR) based on the aircraft type (incl. its associated geometric and propulsive characteristics), takeoff mass, and environmental conditions.
The model first calculates the stall speed based on weight, air density, wing surface area, and a lift coefficient in takeoff configuration, and returns 120% of that stall speed as an estimated safe liftoff speed.
For each airspeed interval up to the liftoff speed, the model then calculates the dynamic pressure, thrust, acceleration, and horizontal distance under all-engines-operating (AEO) conditions. The model then returns 115% of that distance as TODR, in line with regulations (14 CFR § 25.113 and CS-25.113). The model deliberately ignores the accelerate-stop distance (ASD) and the accelerate-go distance (AGD) for now, although they may actually be greater than 115% of the AEO distance.
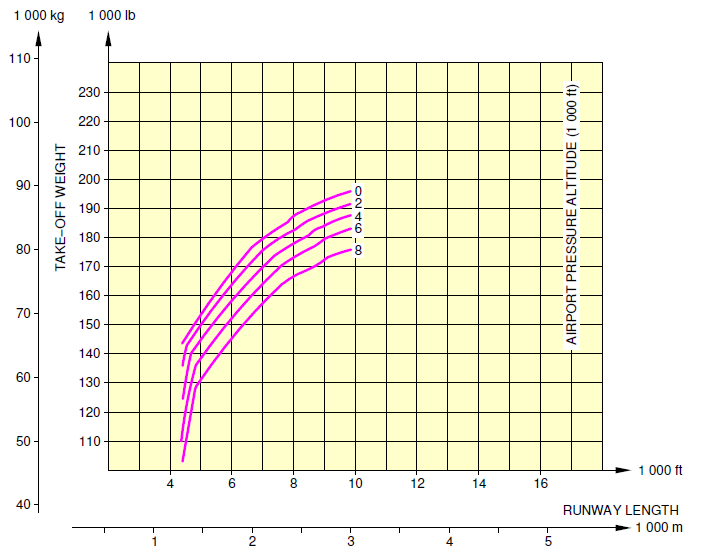
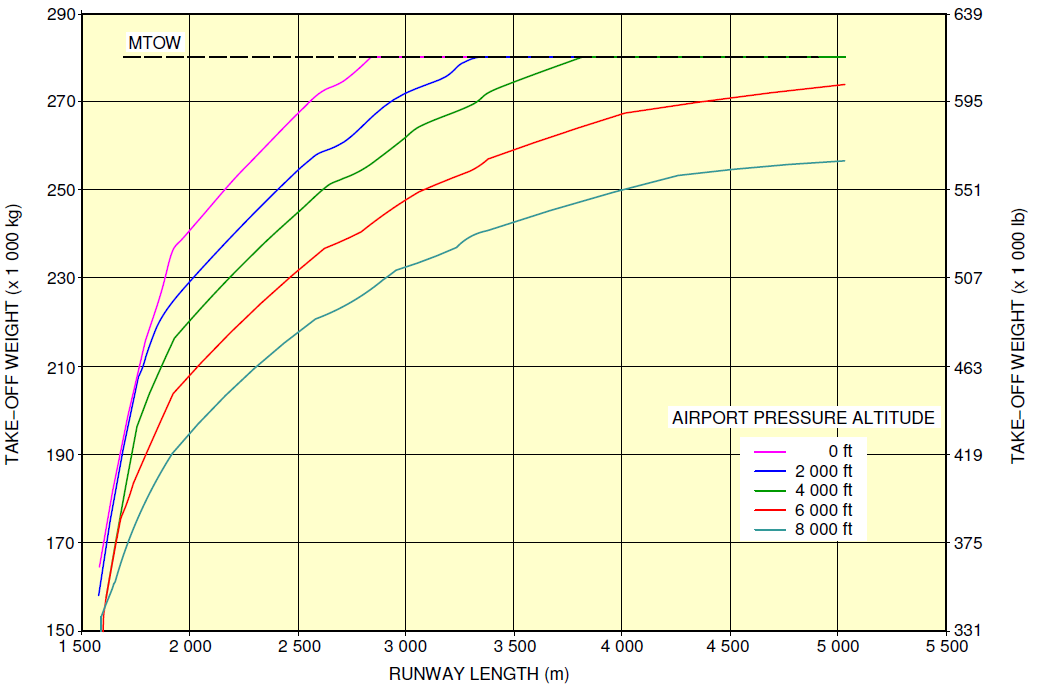
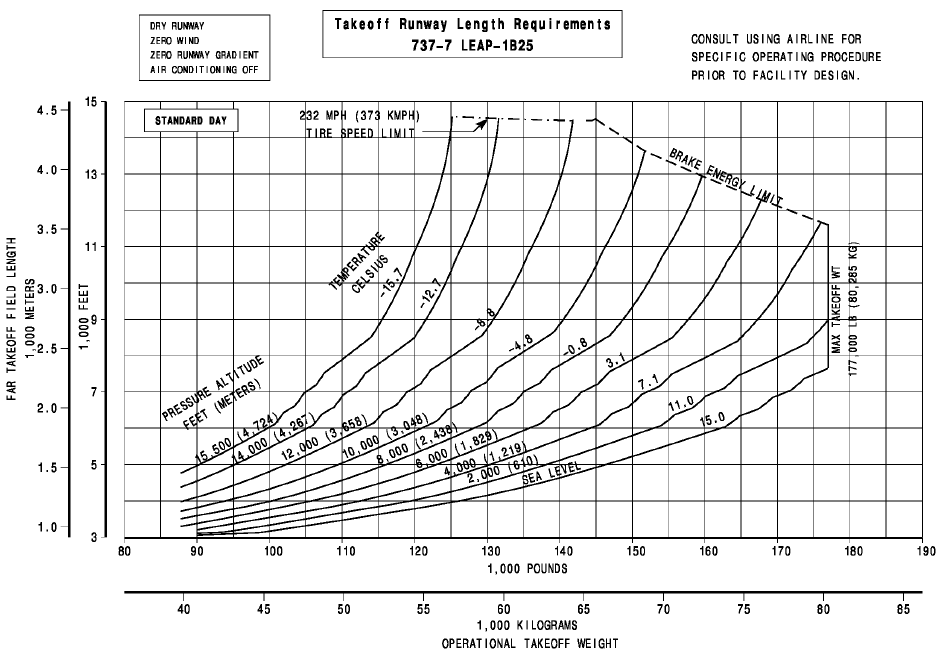
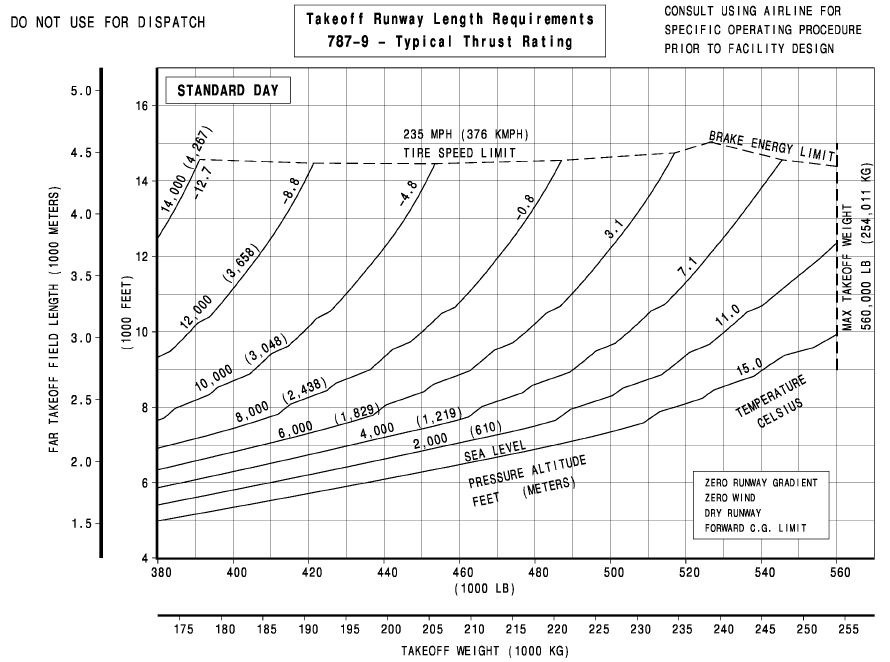
I am calibrating the model (using the lift coefficient as the adjustment variable) for two narrowbody aircraft (A320 neo, B737 Max 9) and two widebody aircraft (A350-900, B787-9). To do so, I use an online plot digitizer to interpolate OEM takeoff performance data (at sea-level ISA conditions) published under the respective "Aircraft Characteristics Airport and Maintenance Planning" (Airbus) and "Airplane Characteristics for Airport Planning" (Boeing) reference documents for each aircraft. The charts in Appendix below are taken from those four documents and provided for easier reference.
Questions
I have three questions about these charts, so that I can make the right calibration assumptions:
Is it reasonable to assume that these charts indicate the horizontal distance traveled by the aircraft up to reaching the screen height of 35 feet, and not just up to liftoff from the runway?
Is the takeoff distance indicated on these charts the regulatory takeoff distance (i.e., the greater of 115% of the AEO distance, ASD, and AGD), or just the actual/physical measured horizontal distance (to either screen height or liftoff, depending on your answer to Q1)?
Is it reasonable to assume that the takeoff distances indicated on these charts were measured using full thrust / TOGA power (i.e., not derated nor assumed temperature / FLEX thrust)?


