In chapter 2 of his book Fluid Dynamic Lift, Sighard Hoerner discusses the influence of thickness by going to the extreme of an airfoil with a circular cross section:
Assuming that we would manage by means of boundary layer control
around the rear side, to displace the stagnation points from zero (at
the forward side) and from 180° (at the rear side) both down toward 90°
(at the lowest point), without losing any momentum, its lift curve
slope would be dCL/dα =4π, rather than = 2π, as in thin foil sections.
Since you desire a mathematical expression: This is the linear approximation he gives:
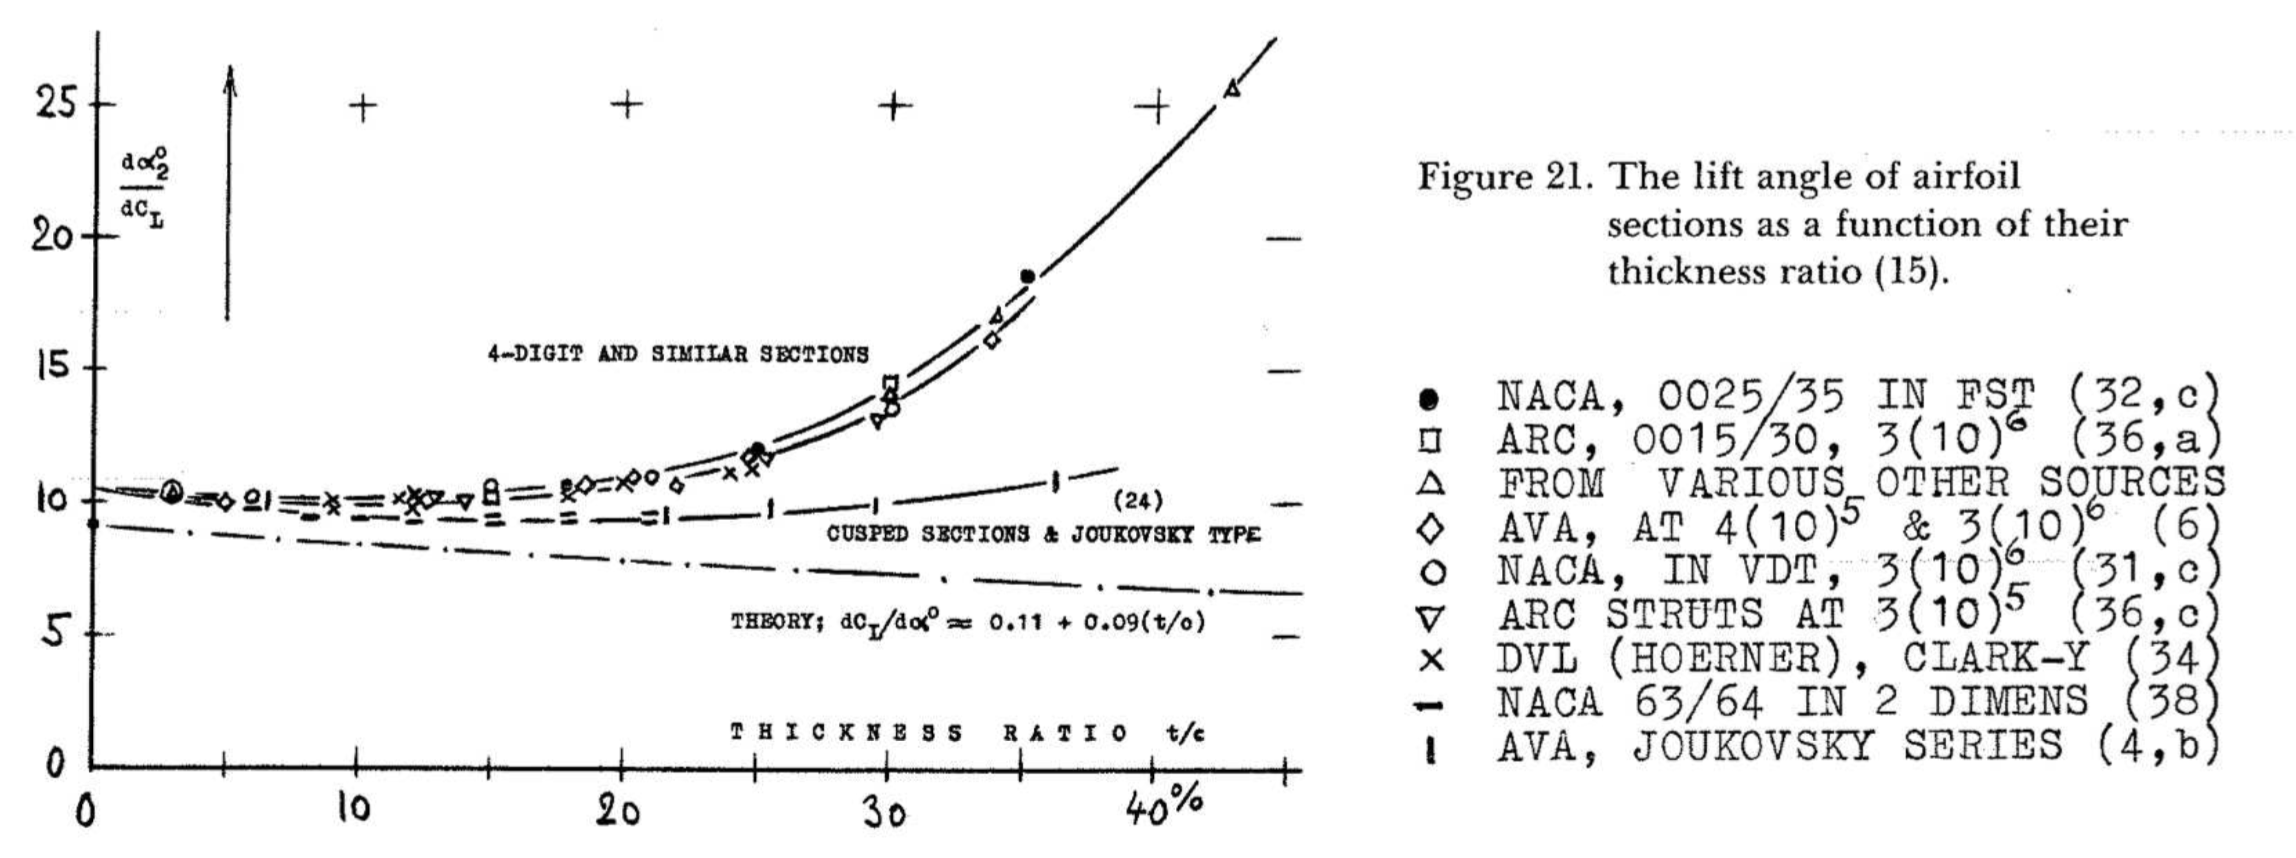
$$c_{L\alpha} \approx 0.11 + 0.09\cdot\frac{t}{c}$$
Note that the lift curve slope is per degree. $\frac{t}{c}$ is the relative thickness of the airfoil.
In figure 21 of that chapter he uses the concept of the lift angle, the angle at which the lift coefficient reaches unity, to show how the lift curve slope varies over airfoil thickness. This plot should demonstrate how limited the applicability of the approximation is in reality.

The lift angle of airfoil sections as a function of their thickness ratio (picture source).
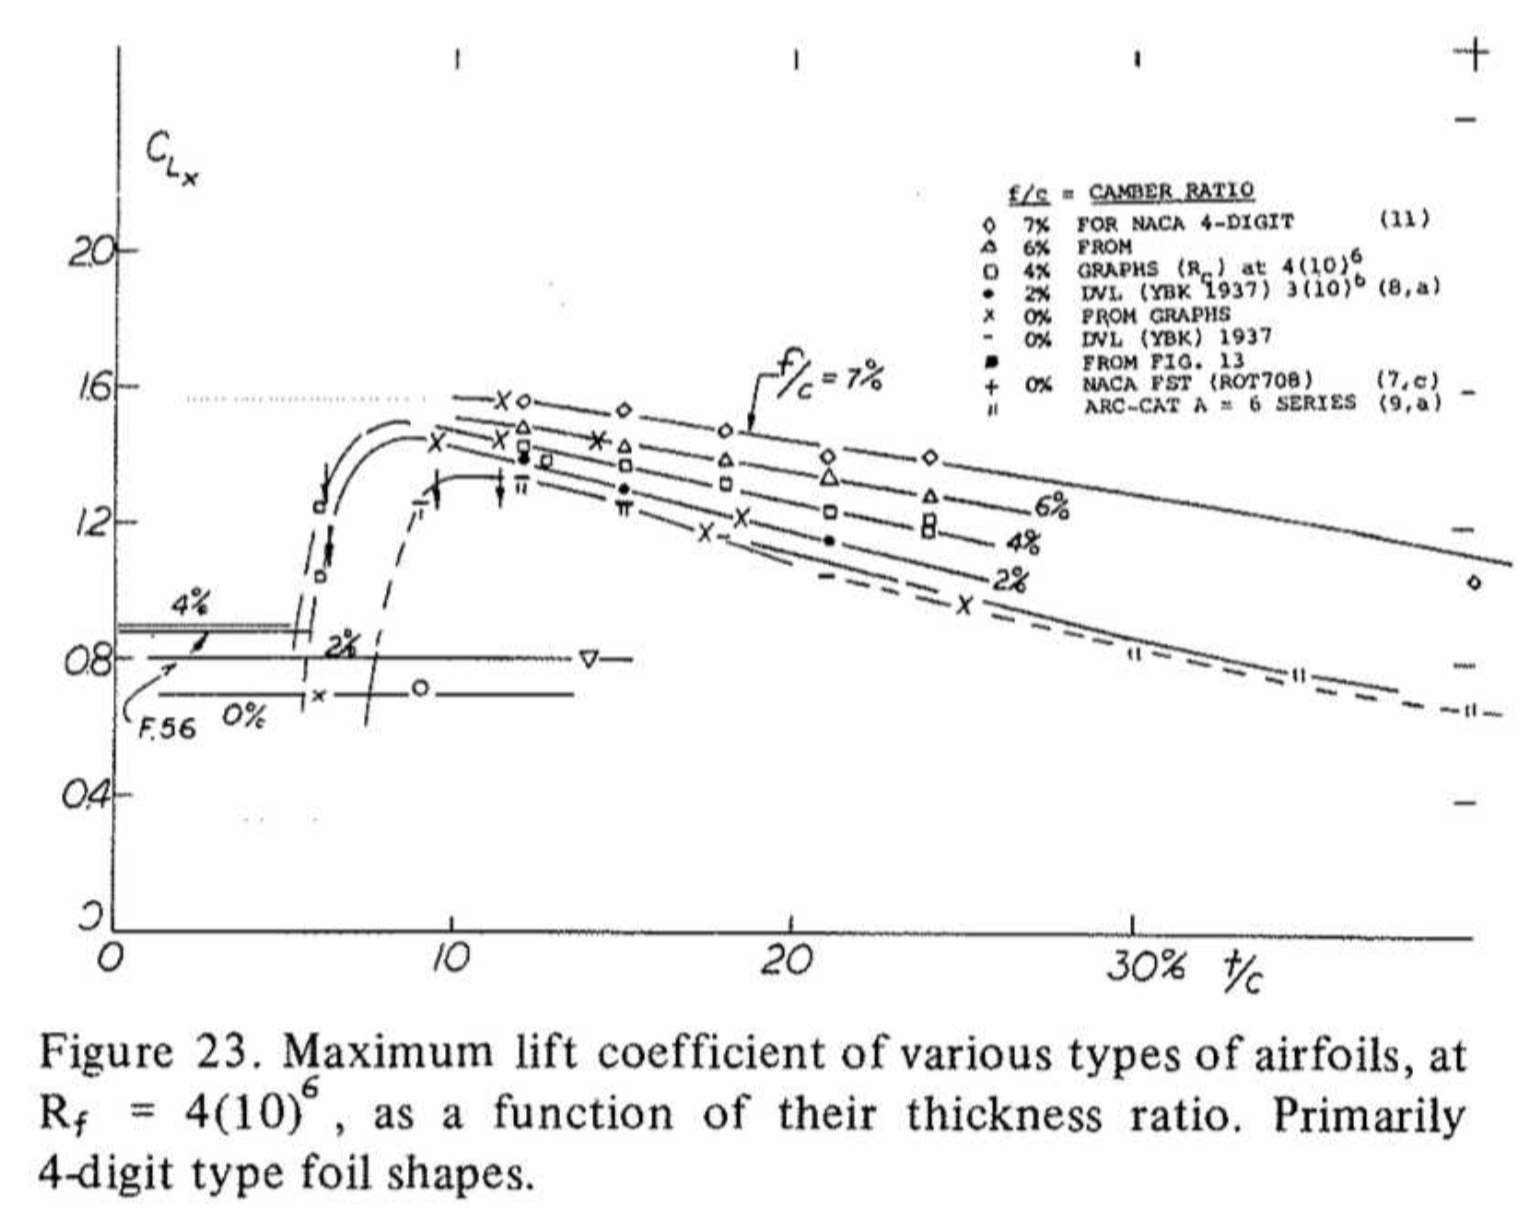
Stall is dominated by flow separation, and the displacement effect of an airfoil adds to the stresses on the boundary layer which determine when the flow separates. On the other hand, thickness is indirectly influenced by the nose radius of the airfoil, and this in turn determines the suction peak at the nose and at higher angles of attack. A higher suction peak also stresses the boundary layer. In consequence, both a too small nose radius (and too small airfoil thickness) and a too high thickness lower the maximum lift coefficient. The sweet spot is at a thickness of around 10%.
In chapter 4, Hoerner looks into that dependency in detail. The plot below does not include highly cambered, thin airfoils, and the straight limit for thin airfoils is misleading.

Maximum lift coefficient of various types of airfoils as a function of their thickness ratio (picture source).


