I live in San Diego almost directly underneath the downwind leg of the normal approach (from the north) to Lindbergh Field (KSAN). The Class B airspace for the entire downwind and base leg areas is between 10,000 and 4,800 feet. Every night I stand out on my back deck and watch the approaches being flown overhead. It appears to me that the airspeeds and altitudes of these approaches are very similar and I'm curious about what they are. Are these published anywhere or is there some accepted norm for a typical airliner approach to a sea level airport? Although I could be mistaken, as I watch the turns from downwind to base and base to final, it appears that the altitude is held fairly constant and that final descent doesn't start until final approach. If anyone has any insights, I'd be interested to hear what they are.
1 Answer
Almost every major airport (Class B) would have what's called a STAR, a Standard Terminal Arrival Route. Busy Class B traffic doesn't necessarily follow a TPA (Traffic Pattern Altitude).
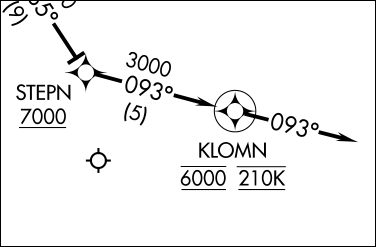
For runway 09, the STAR doesn't show a speed limit. Some STARs have speed limits.
But that's not to say the speed is at the pilot's discretion, as the airplane approaches an airport it's standard for the crew to slow down and prepare the plane for landing. The air traffic control (ATC) can also issue speed restrictions to properly space the arriving traffic, they have the bigger picture.
For the downwind leg you can expect something like 200 knots indicated, which can translate to a bit over or under 200 knots of ground speed, depending on the wind. That's 230 mph or 370 km/h.
As the planes join the final approach segment, the altitude would indeed be level in most cases, and further descent would commence as you said, on final approach.
No published speed limit on downwind. The line with an arrow pointing to IFSOX.
For altitude it's 4000 feet, the *3000 is the minimum to clear any obstructions. 2400' for the base leg.
Above is a chart legend.
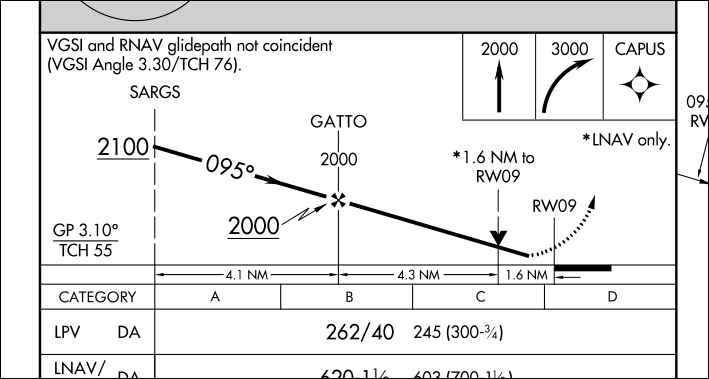
Final approach descent begins about 10 nautical miles to touch down, as illustrated from 2100 feet for this particular approach to runway 09.
Numbers in this answer are for one particular approach to one runway, figures vary.
Source: skyvector.com
Class B around KSAN is a bit complicated in shape, but the base/floor is mostly 2800' for the southern published downwind area (if you overlay the STAR on a VFR chart). Airline/IFR pilots don't need to worry about that chart as they'll be following the aforementioned STAR or guided/vectored by ATC.
I misread the question, from the north it's 6000 feet and 210 knots, the BAYVU (pronounced bay-view) FOUR ARRIVAL (STAR). That should be downwind for runway 27. The same principles apply, different figures.
See where you live (coordinates), download all the STAR charts, and you'll have a better picture of your night sky. Note: some STAR charts are not-to-scale.
-
2$\begingroup$ I made a map of the RNAV arrivals and approaches. It will open in Google Maps. If you click on the waypoints it should show altitude and speed info. Here's the link: google.com/maps/d/… $\endgroup$– TomMcWCommented Aug 27, 2016 at 1:56
-
$\begingroup$ @ymb1 None of the STAR or instrument approaches on airnav.com corresponded to the one I am referring to, but SWEETWATER VISUAL RWY 27 is the one. I don't know much about instrument flying so I have as many questions as answers, but my main question is answered by this plate and your answer. Thanks. $\endgroup$– PJNoesCommented Aug 31, 2016 at 17:09
-
$\begingroup$ @TomMcW I don't know how you created that overlay for Google Maps but it is very cool. $\endgroup$– PJNoesCommented Aug 31, 2016 at 17:17
-
1$\begingroup$ @PJNoes I just used Google maps' online site to draw it. It helps in visualizing where the flight paths are in relation to the ground because the aeronautical charts are not to scale. The time consuming part is looking up the coordinates for each of the waypoints. KSAN only has the one runway so it only took about 45 min. I've done charts for MCI and MEM. MEM has 4 runways, 24 published approaches, 11 arrival routes and 19 departures. It took me months! $\endgroup$– TomMcWCommented Aug 31, 2016 at 18:02


