The lift distribution is given by:
$$l(\eta)=c_l(\eta)\,c(\eta)\,q$$
Where $\eta$ is the spanwise coordinate.
The notation $l(\eta)$ is meant to emphasize that the local lift $l$ is a function of $\eta$ -- i.e. it varies with $\eta$. Likewise, $c_l(\eta)$ and $c(\eta)$ are meant to emphasize that the local 2D lift coefficient $c_l$ and the local chord $c$ both can vary with span.
Often, we will divide by the dynamic pressure.
$$\frac{l(\eta)}{q}=c_l(\eta)\,c(\eta)$$
Aerodynamicists will use the quantity $c_l(\eta)\,c(\eta)$ as a scaled version of the lift distribution. Sometimes, they divide by a reference chord $\bar{c}$
$$\frac{l(\eta)}{q\,\bar{c}}=\frac{c_l(\eta)\,c(\eta)}{\bar{c}}$$
This still gives us a curve with the shape of the local lift distribution, but divided by two constants such that it is scaled to be similar to aircraft lift coefficients.
The important part here is that a non-uniform lift distribution $l(\eta)$ (which is all of them) means that the local lift coefficient $c_l(\eta)$ and or the local chord $c(\eta)$ also have a non-uniform distribution.
In fact, if the lift is large at the tips, that means that the local lift coefficient and/or the chord must be large at the tips.
Or, if the wing tapers (chord gets small at the tips), then even a uniform lift distribution will cause the lift coefficient to increase at the tips. We can see this by one more algebraic manipulation.
$$\frac{l(\eta)}{q\,c(\eta)}=c_l(\eta)$$
Here we see that the local lift coefficient depends on the ratio of the local lift and the local chord.
OK, what does all this mean?
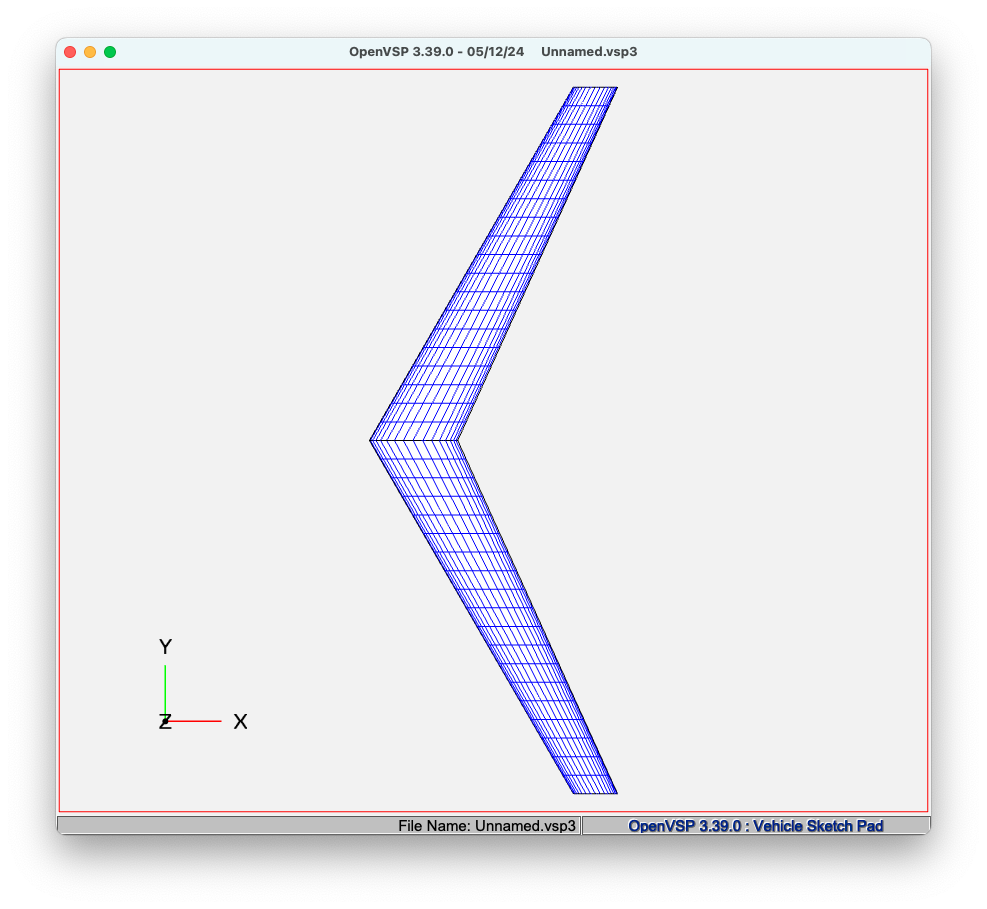
Here is a swept wing (30 deg at the LE) with some taper ($\lambda$=0.5):
Here is the resulting lift distribution:
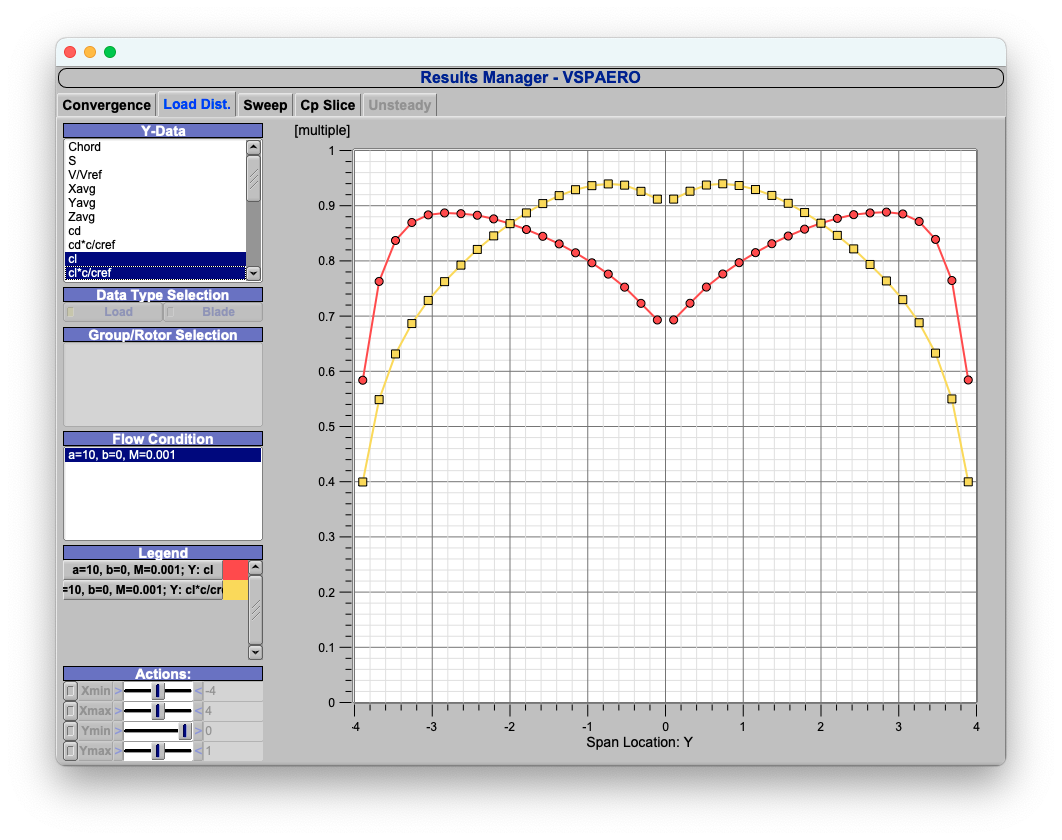
The lift distribution (cl*c/cref) is in yellow, and the lift coefficient (cl) is in red.
The local lift coefficient represents how 'hard' that part of the wing is working. Let's assume that this particular airfoil is expected to stall at $c_l$=1.0. That is a 2D number -- and clearly this is a 3D flow. However, we can use the sectional lift coefficient compared to the 2D stall lift coefficient for the airfoil as a simple measure of how close to stall you are.
We see that this wing (at this angle of attack) reaches a peak sectional lift coefficient of about 0.887 at a span location of Y=2.8.
In terms of your question, the peak sectional lift coefficient is relatively outboard -- which means the wing will likely stall at that section (near the tip) first.
Here is the same chart for an un-swept wing (zero degrees at c/4).
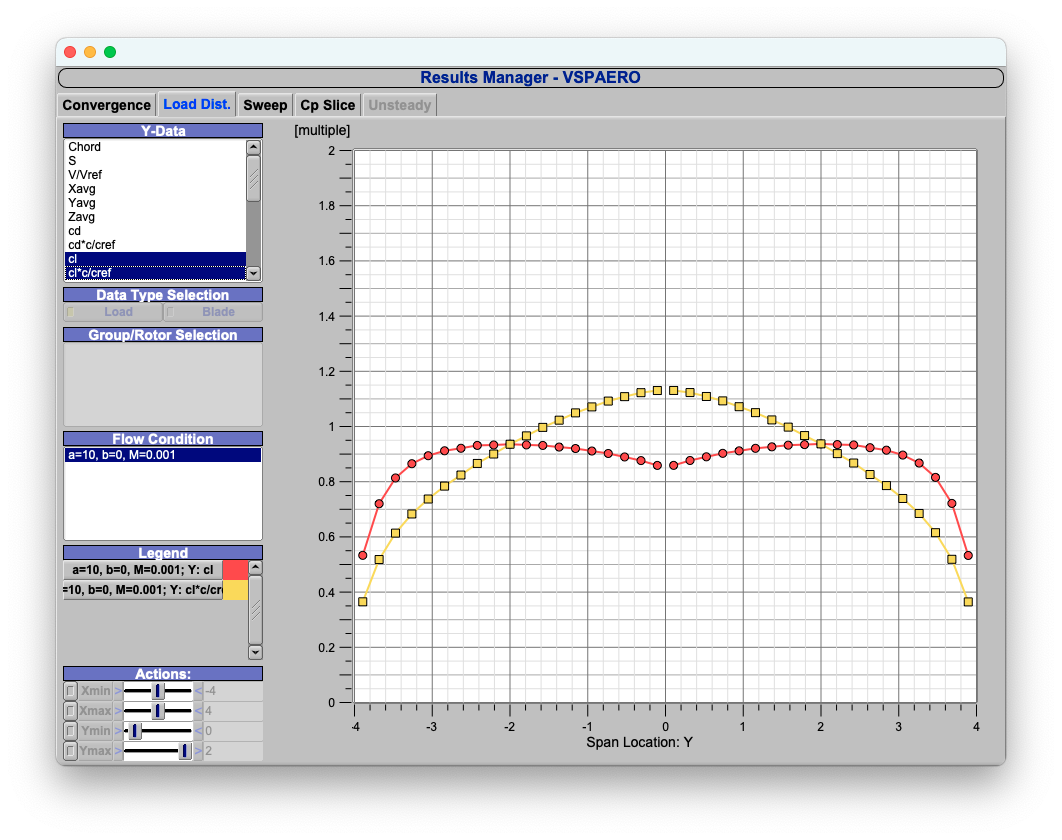
Notice how the location of the peak lift coefficient moved inboard? Also notice how the lift coefficient distribution is much flatter?
Here is the un-swept wing, with the taper eliminated. Consequently, the yellow and red curves are identical.:
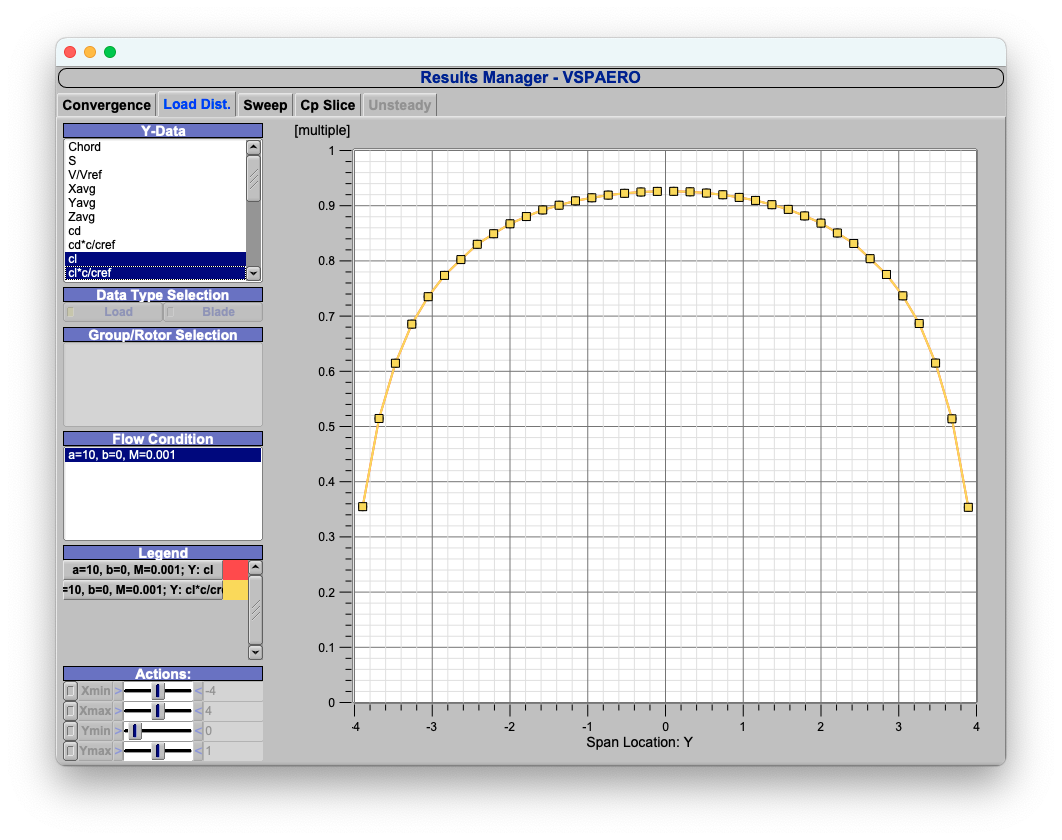
For an un-swept and un-tapered (and un-twisted) wing, the peak of the lift distribution is at the center line. This will stall from the center out, producing almost no rolling moment from the stall.
And, for completeness, here is the swept, but constant chord wing, again the red and yellow curves are identical.
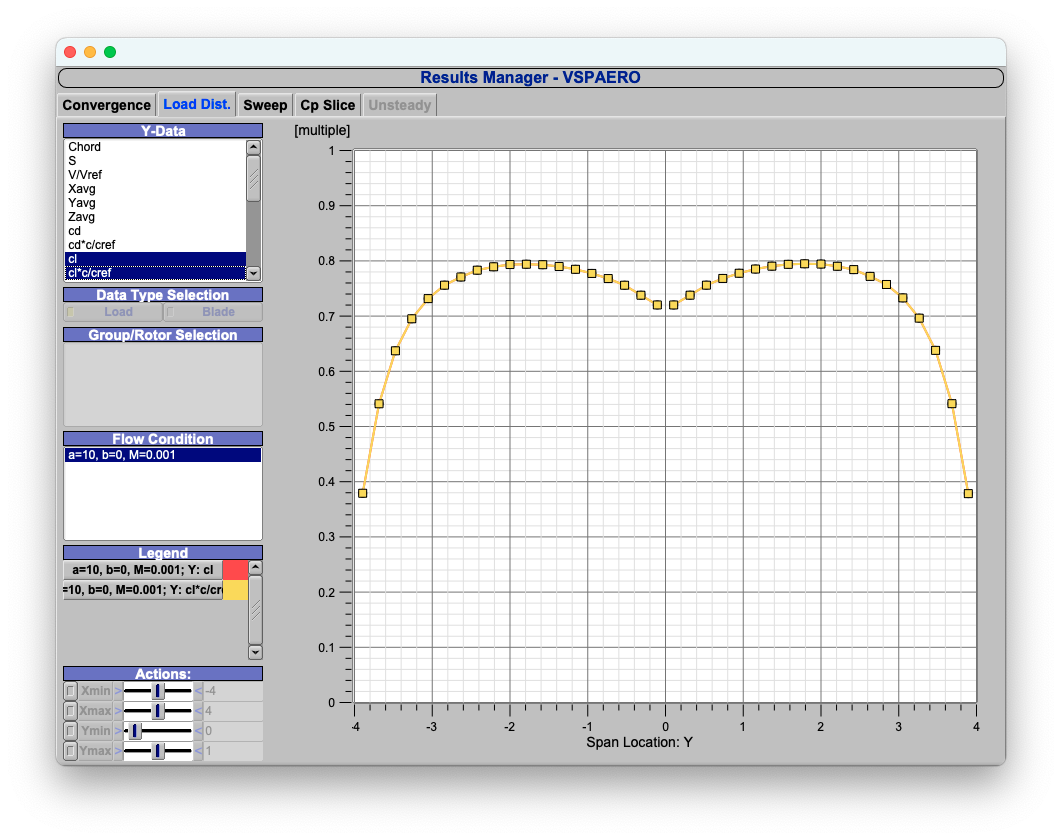
As you can see, sweeping the wing changes the lift distribution and moves the peak of the lift coefficient outboard.
Swept wings are usually combined with tapered wings, which further pushes the peak of the lift coefficient outboard.
These things can result in wings with poor tip stall behavior.
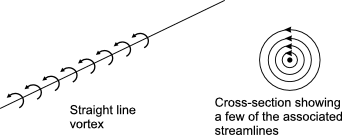
Edit: Include image of line vortex influence.
When we talk about potential flow, we talk about how certain flow structures (sources, sinks, vortices, doublets, freestream) cause a velocity field around them. We combine many such flow structures to assemble a complex flow.
In the math abstraction, we say that the vortex causes a velocity field around it. However, when we talk about a wingtip vortex, we don't really believe the causality works the same way. The flow results in the wingtip vortex, not the other way around. I know this is confusing.
Here is an image depicting what a line vortex does. A vortex of a given strength causes a velocity field around it. Notice that a vortex has no influence on itself.
So, the trailing vortices cause a velocity increment at other places on the wing. So their influence is felt someplace else -- not at the location of the vortex.
