added 64 characters in body
Source Link
Peter Kämpf
  • 237.3k
  • 17
  • 601
  • 944

First, let me illustrate how I understand your question. Please comment accordingly if I got you wrong.

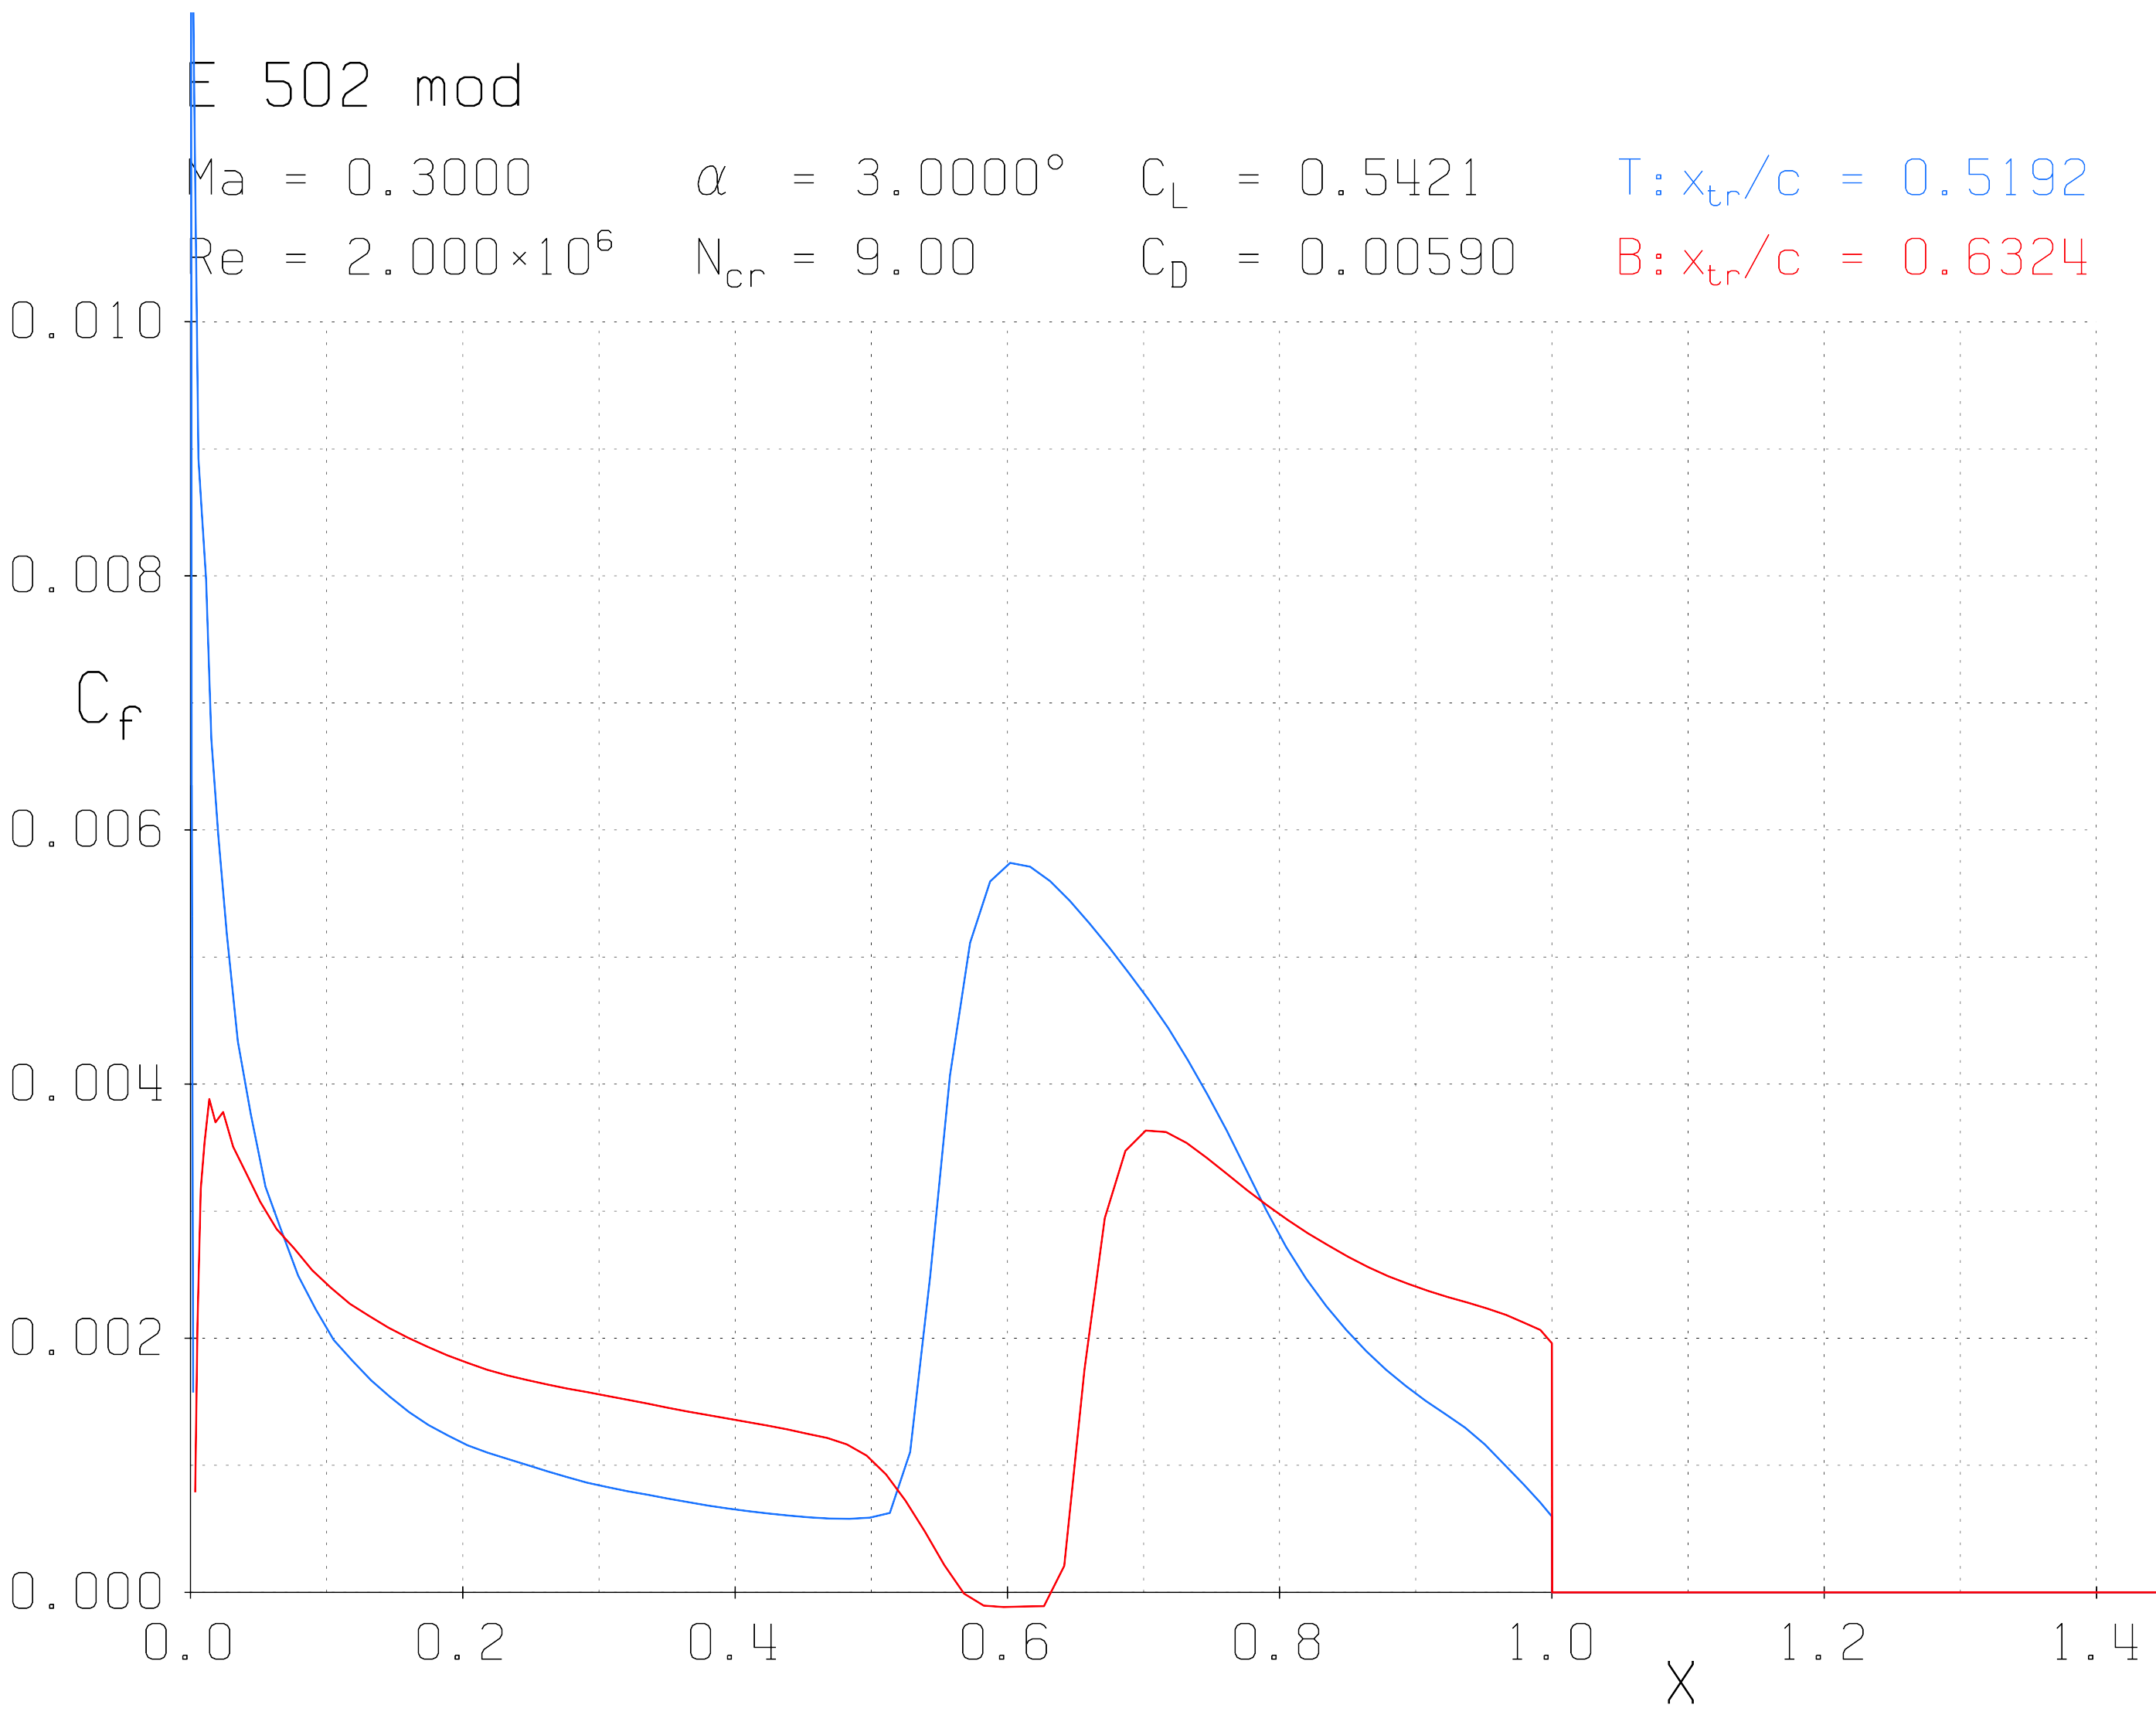
Below you see the friction drag computed by XFOIL for an airfoil at 3° angle of attack.
E502mod at 3° AoA, friction plot

Friction drag over chord for an E502mod airfoil at 3° AoA. Blue: Top surface, Red: Bottom surface. Source: XFOIL 6.97.

And here is a plot of the pressure distribution at that point:
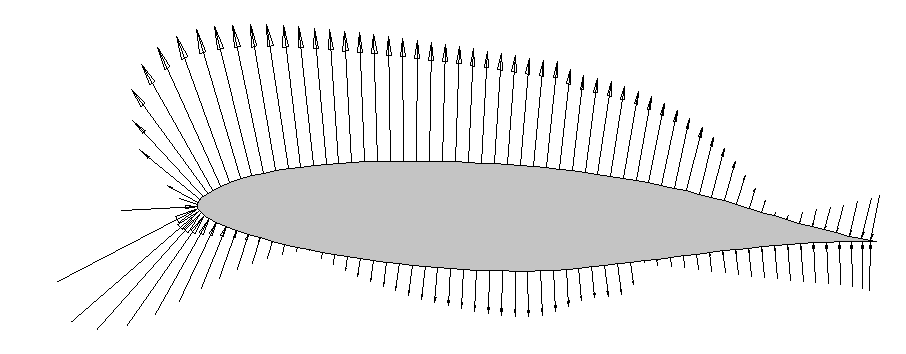
Same airfoil, now with arrows to indicate pressure

Where the longest arrow pointing at the airfoil contour points to is the stagnation point. So the large blue peak in the first plot is exactly in the region of the nose where its curvature is strongest and the surface is mostly vertical. Integrating all the friction drag over the height of the airfoil should result in a small upwards component from that high local friction around the nose. Lift, from friction, in other words.

Did I understand that correctly?

I've never seen that component of lift being mentioned separately, but expect thatand even XFOIL includesdoes not include it in its calculations (I need to checkjust checked the FORTRAN source to be sure, haven't done so yetI have lying around). You assume correctly that this component is indeed negligibly small, it is about two orders of magnitude smaller than the pressure forces.

First, let me illustrate how I understand your question. Please comment accordingly if I got you wrong.

Below you see the friction drag computed by XFOIL for an airfoil at 3° angle of attack.

E502mod at 3° AoA, friction plot

Friction drag over chord for an E502mod airfoil at 3° AoA. Blue: Top surface, Red: Bottom surface. Source: XFOIL 6.97.

And here is a plot of the pressure distribution at that point:

Same airfoil, now with arrows to indicate pressure

Where the longest arrow pointing at the airfoil contour points to is the stagnation point. So the large blue peak in the first plot is exactly in the region of the nose where its curvature is strongest and the surface is mostly vertical. Integrating all the friction drag over the height of the airfoil should result in a small upwards component from that high local friction around the nose. Lift, from friction, in other words.

Did I understand that correctly?

I've never seen that component of lift being mentioned separately, but expect that XFOIL includes it in its calculations (I need to check the source to be sure, haven't done so yet). You assume correctly that this component is indeed negligibly small.

First, let me illustrate how I understand your question. Please comment accordingly if I got you wrong.

Below you see the friction drag computed by XFOIL for an airfoil at 3° angle of attack.

E502mod at 3° AoA, friction plot

Friction drag over chord for an E502mod airfoil at 3° AoA. Blue: Top surface, Red: Bottom surface. Source: XFOIL 6.97.

And here is a plot of the pressure distribution at that point:

Same airfoil, now with arrows to indicate pressure

Where the longest arrow pointing at the airfoil contour points to is the stagnation point. So the large blue peak in the first plot is exactly in the region of the nose where its curvature is strongest and the surface is mostly vertical. Integrating all the friction drag over the height of the airfoil should result in a small upwards component from that high local friction around the nose. Lift, from friction, in other words.

Did I understand that correctly?

I've never seen that component of lift being mentioned separately, and even XFOIL does not include it in its calculations (just checked the FORTRAN source I have lying around). You assume correctly that this component is indeed negligibly small, it is about two orders of magnitude smaller than the pressure forces.

Source Link
Peter Kämpf
  • 237.3k
  • 17
  • 601
  • 944

First, let me illustrate how I understand your question. Please comment accordingly if I got you wrong.

Below you see the friction drag computed by XFOIL for an airfoil at 3° angle of attack.

E502mod at 3° AoA, friction plot

Friction drag over chord for an E502mod airfoil at 3° AoA. Blue: Top surface, Red: Bottom surface. Source: XFOIL 6.97.

And here is a plot of the pressure distribution at that point:

Same airfoil, now with arrows to indicate pressure

Where the longest arrow pointing at the airfoil contour points to is the stagnation point. So the large blue peak in the first plot is exactly in the region of the nose where its curvature is strongest and the surface is mostly vertical. Integrating all the friction drag over the height of the airfoil should result in a small upwards component from that high local friction around the nose. Lift, from friction, in other words.

Did I understand that correctly?

I've never seen that component of lift being mentioned separately, but expect that XFOIL includes it in its calculations (I need to check the source to be sure, haven't done so yet). You assume correctly that this component is indeed negligibly small.